Whirrwork Research
보도자료 및 미디어 키트
우리는 누구인지, 데이터를 어떻게 모으는지, 팩트 시트, 로고, 삽입 가능한 차트, 데이터에서 나온 기사 아이디어.
통계 문장, 인용문, 보고서 본문은 우리가 검증에 사용하는 언어인 영어로 제공됩니다. 이 페이지의 탐색 요소는 자동 번역되었습니다.
우리는 누구인가
Whirrwork는 로봇 작업, 로봇 서비스 업체, 공개 출처가 있는 가격을 모은 무료 글로벌 디렉터리입니다. 애초에 로봇이 필요한지, 그 일에 비용이 얼마나 드는지 판단하도록 돕습니다.
Whirrwork는 구매자에게 무료입니다. 구매자 수수료도, 돈을 내고 순위를 올리는 제도도 없습니다. 공급업체 등록도 무료입니다. 광고 추적기를 쓰지 않으며 데이터를 판매하지 않습니다.
데이터를 모으는 방법
업체와 가격은 공개 출처에서 모읍니다: 기업 웹사이트, 공개 요금표, 공공 입찰, 농업 기술 보급 기관, 규제 기관. 모든 가격은 그 가격을 밝힌 페이지로 날짜와 함께 연결됩니다. 외부 통계는 게시 전에 출처와 다시 대조합니다.
팩트 시트
Data release 2026-10, as of Oct 25, 2026.
| Robot jobs tracked | 308 |
|---|---|
| Providers listed | 681 |
| Countries covered | 65 |
| Sourced price points | 302 |
| Jobs with no public price | 71% |
| Citable statistics | 115 |
| Languages | 13 |
| Price for buyers | Free |
언론 문의
데이터 질문, 정정, 인터뷰 요청은 문의 양식을 이용해 주세요. 정정 제안 항목을 고르고 회사 칸에 매체명을 적어 주세요. 모든 메시지는 사람이 직접 읽습니다.
Press email: press@whirrwork.com
로고
로고는 밝은 배경과 어두운 배경 모두에 쓸 수 있습니다. 사방에 가운데 원만큼의 여백을 두세요. 최소 크기는 심볼 20 px, 전체 로고 96 px입니다. 심볼을 회전하거나, 날개 색을 바꾸거나, 로봇에 얼굴을 그리거나(유혹적인 건 압니다), 주황색 심볼을 주황색 위에 놓지 말아 주세요.




차트
모든 차트는 데이터로 생성되며 이미지 안에 출처가 들어 있습니다. 아래 코드로 삽입하거나 SVG 또는 PNG로 내려받으세요.
삽입 코드
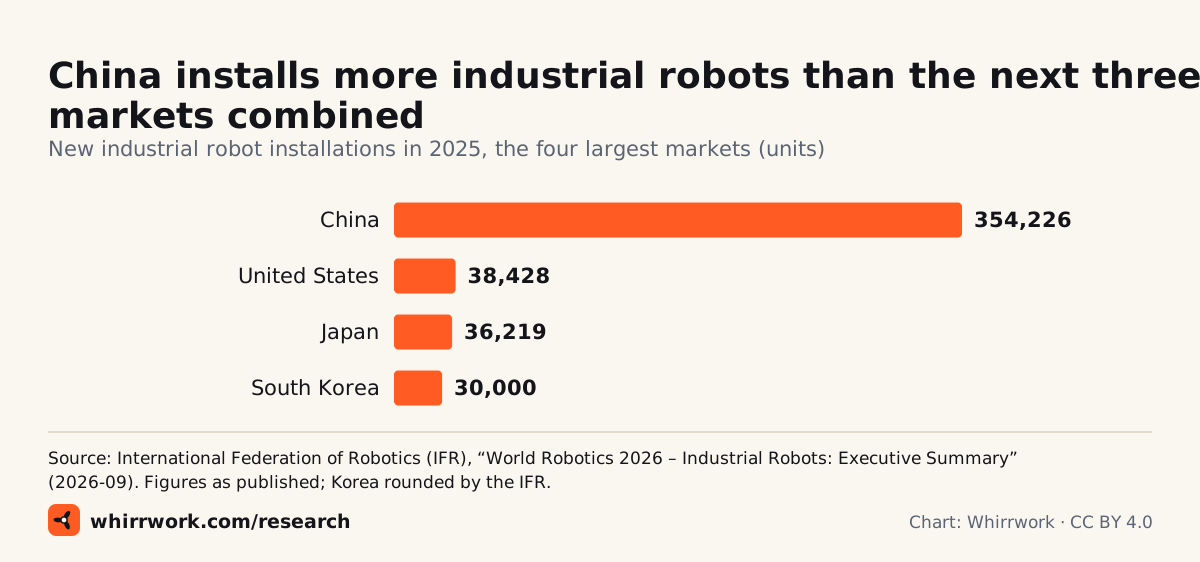
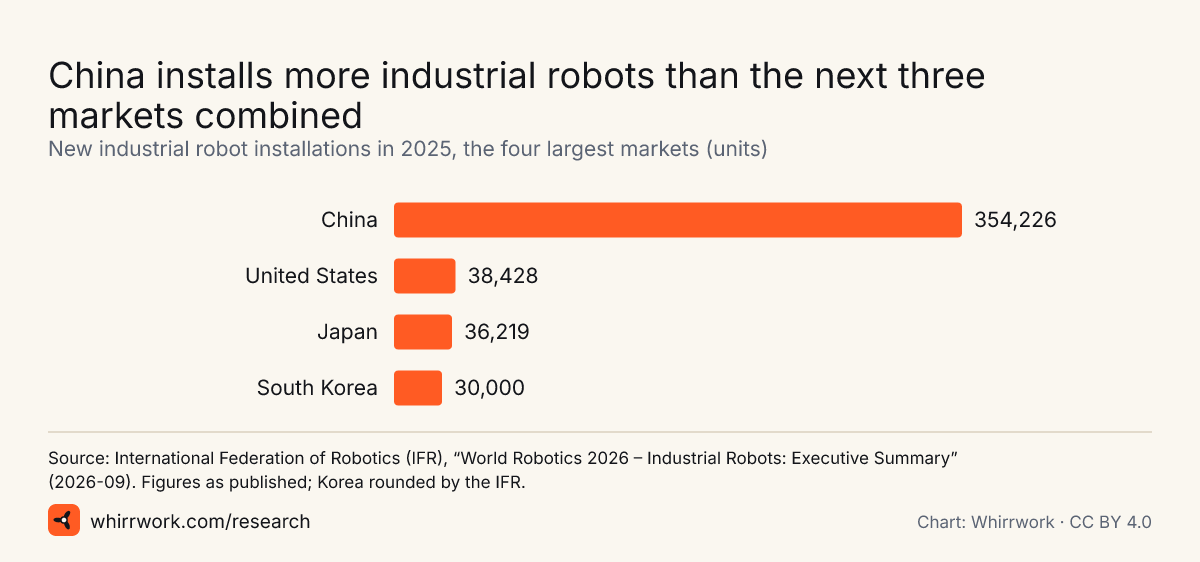
<a href="https://whirrwork.com/press/#chart-ifr-industrial-robot-installations-top-markets-2025"><img src="https://whirrwork.com/research/charts/ifr-industrial-robot-installations-top-markets-2025.svg" width="1200" height="562" alt="Bar chart of 2025 industrial robot installations: China 354,226, United States 38,428, Japan 36,219, Republic of Korea 30,000."></a>
<p>Chart: <a href="https://whirrwork.com/research/">Whirrwork</a>, CC BY 4.0. Data: International Federation of Robotics (IFR), “World Robotics 2026 – Industrial Robots: Executive Summary” (2026-09). Figures as published; Korea rounded by the IFR.</p>
삽입 코드
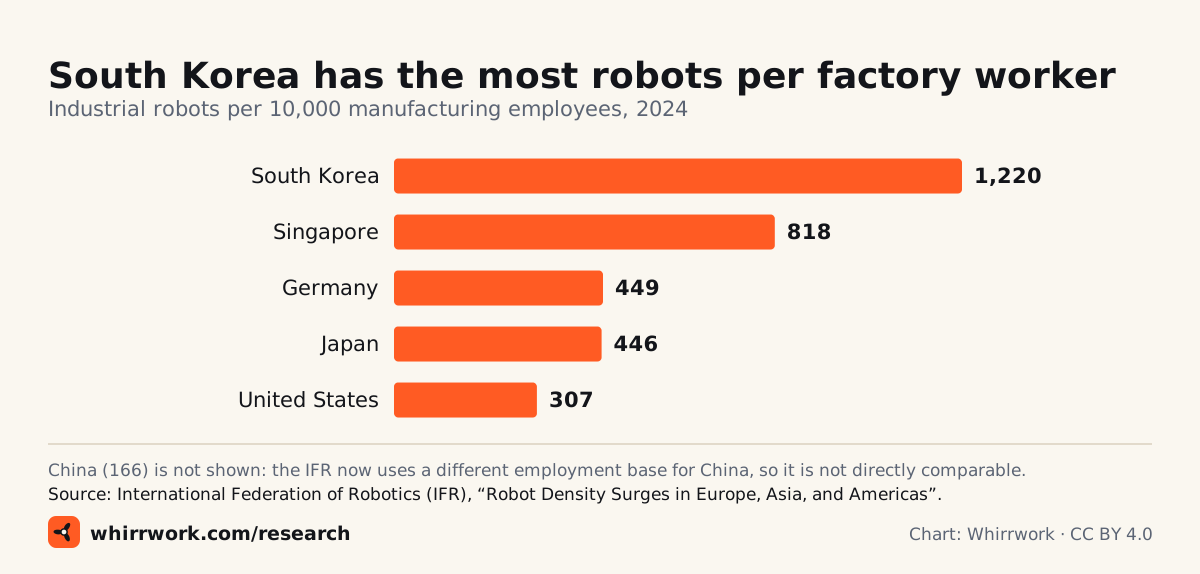
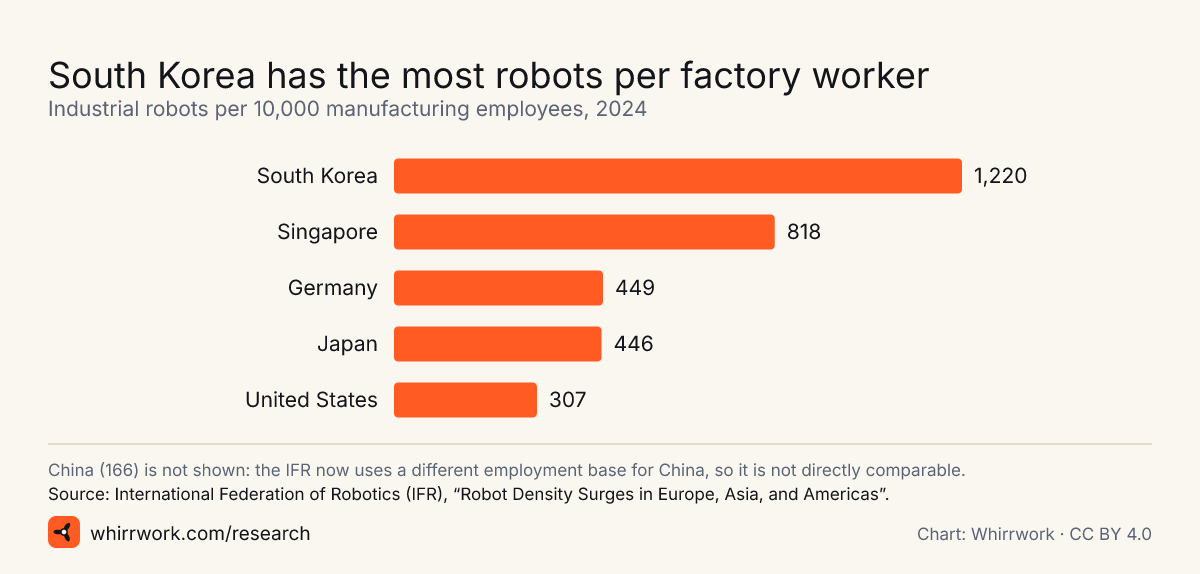
<a href="https://whirrwork.com/press/#chart-ifr-robot-density-2024"><img src="https://whirrwork.com/research/charts/ifr-robot-density-2024.svg" width="1200" height="574" alt="Bar chart of robot density in 2024: Republic of Korea 1,220, Singapore 818, Germany 449, Japan 446, United States 307 robots per 10,000 manufacturing employees."></a>
<p>Chart: <a href="https://whirrwork.com/research/">Whirrwork</a>, CC BY 4.0. Data: International Federation of Robotics (IFR), “Robot Density Surges in Europe, Asia, and Americas”.</p>
삽입 코드
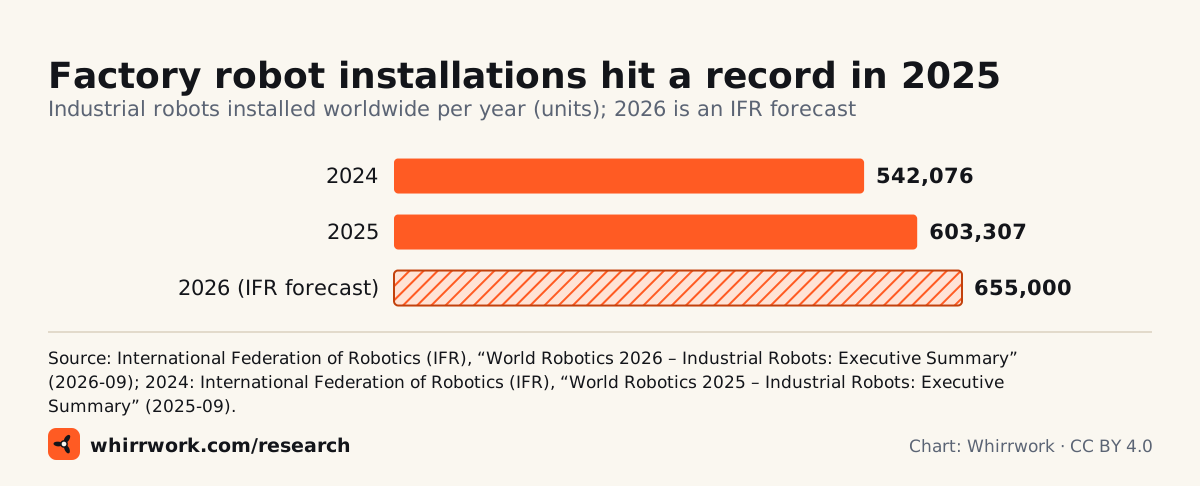
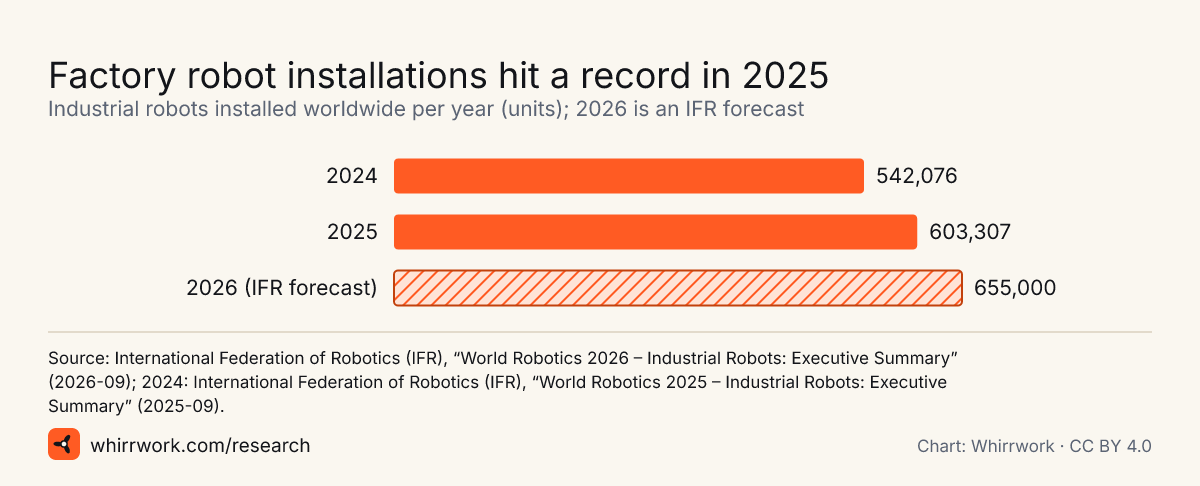
<a href="https://whirrwork.com/press/#chart-ifr-world-industrial-robot-installations-2024-2026"><img src="https://whirrwork.com/research/charts/ifr-world-industrial-robot-installations-2024-2026.svg" width="1200" height="486" alt="Bar chart: 542,076 industrial robots installed in 2024, 603,307 in 2025, and an IFR forecast of 655,000 for 2026."></a>
<p>Chart: <a href="https://whirrwork.com/research/">Whirrwork</a>, CC BY 4.0. Data: International Federation of Robotics (IFR), “World Robotics 2026 – Industrial Robots: Executive Summary” (2026-09); 2024: International Federation of Robotics (IFR), “World Robotics 2025 – Industrial Robots: Executive Summary” (2025-09).</p>
삽입 코드
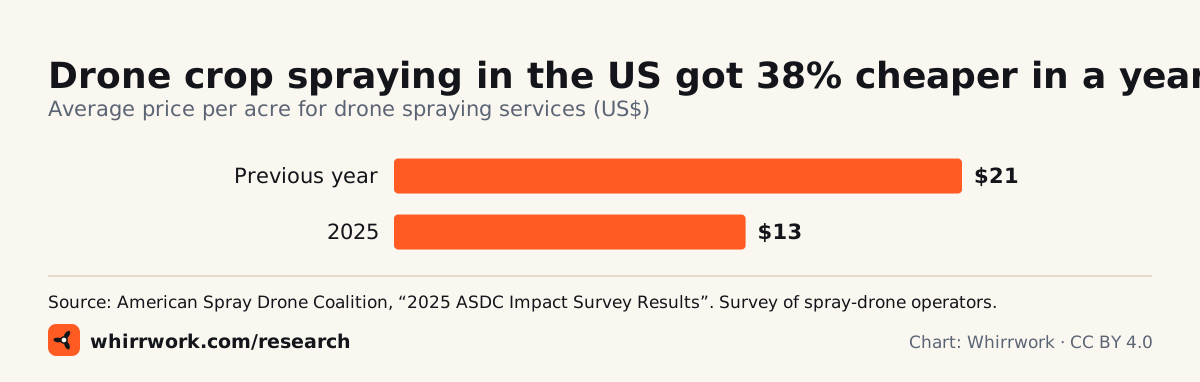
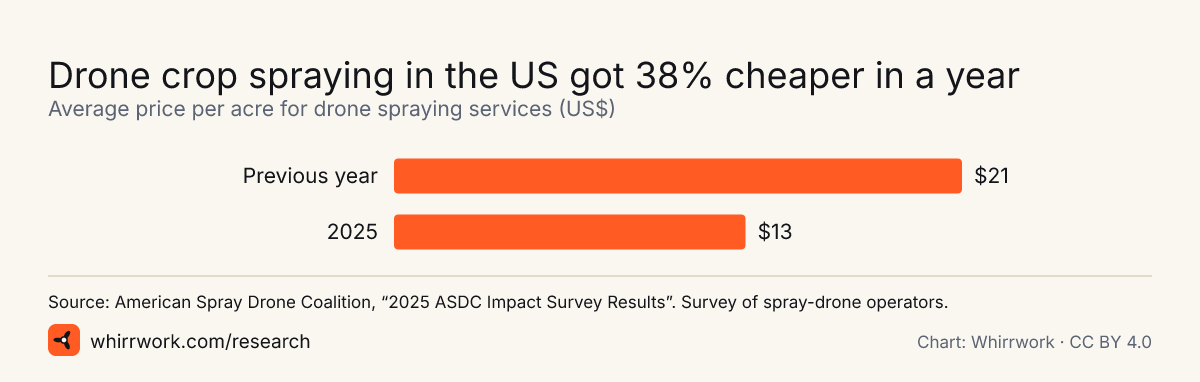
<a href="https://whirrwork.com/press/#chart-asdc-us-drone-spraying-price-per-acre"><img src="https://whirrwork.com/research/charts/asdc-us-drone-spraying-price-per-acre.svg" width="1200" height="382" alt="Bar chart: average US drone spraying price per acre, Previous year $21, 2025 $13."></a>
<p>Chart: <a href="https://whirrwork.com/research/">Whirrwork</a>, CC BY 4.0. Data: American Spray Drone Coalition, “2025 ASDC Impact Survey Results”. Survey of spray-drone operators.</p>
삽입 코드
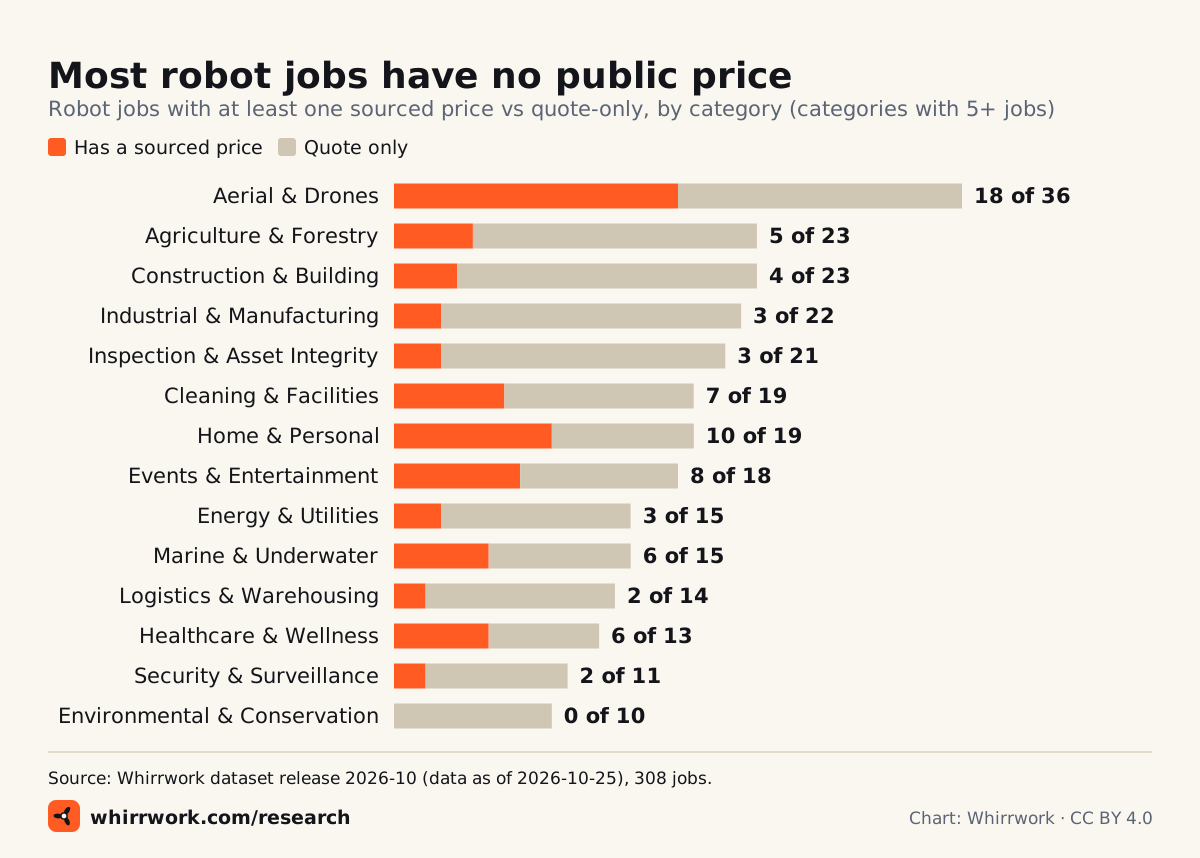
<a href="https://whirrwork.com/press/#chart-whirrwork-priced-jobs-by-category"><img src="https://whirrwork.com/research/charts/whirrwork-priced-jobs-by-category.svg" width="1200" height="858" alt="Stacked bar chart of robot jobs with a public price by category. Overall 88 of 308 jobs have a sourced price."></a>
<p>Chart: <a href="https://whirrwork.com/research/">Whirrwork</a>, CC BY 4.0. Data: Whirrwork dataset release 2026-10 (data as of 2026-10-25), 308 jobs.</p>
삽입 코드
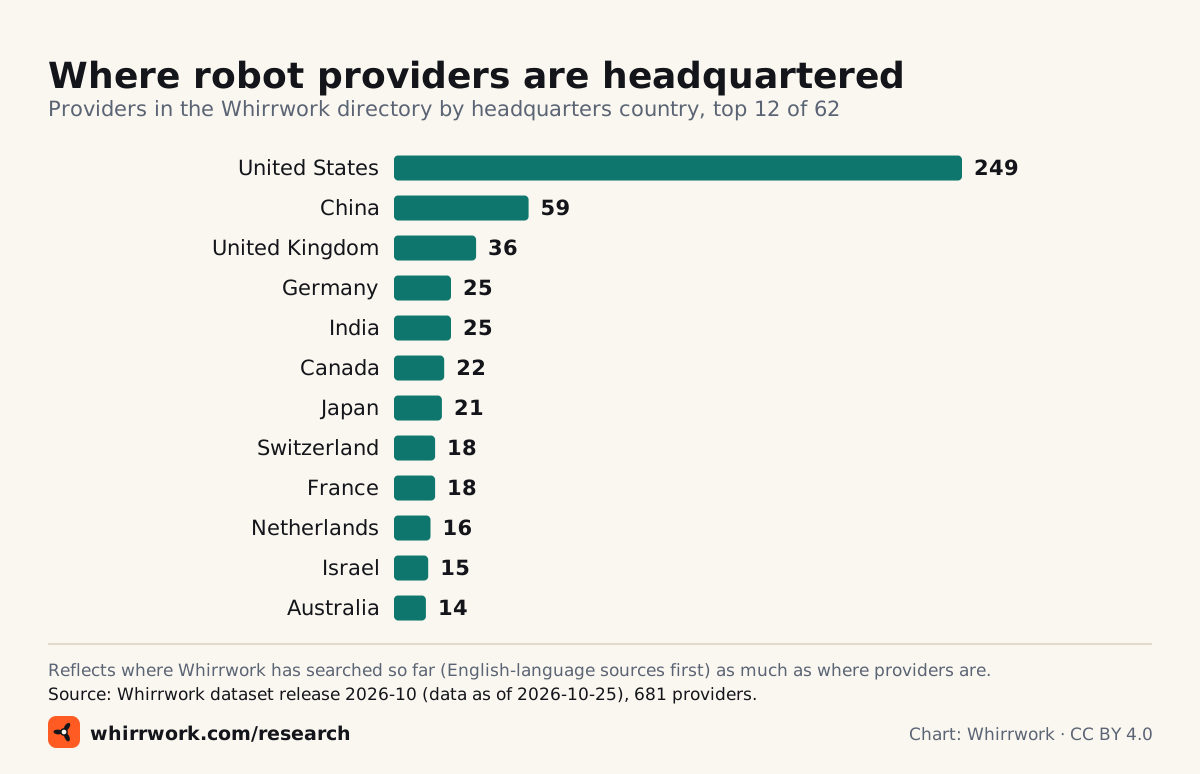
<a href="https://whirrwork.com/press/#chart-whirrwork-providers-by-hq-country"><img src="https://whirrwork.com/research/charts/whirrwork-providers-by-hq-country.svg" width="1200" height="774" alt="Bar chart of providers by headquarters country: United States 249, China 59, United Kingdom 36, Germany 25, India 25, and more."></a>
<p>Chart: <a href="https://whirrwork.com/research/">Whirrwork</a>, CC BY 4.0. Data: Whirrwork dataset release 2026-10 (data as of 2026-10-25), 681 providers.</p>
삽입 코드
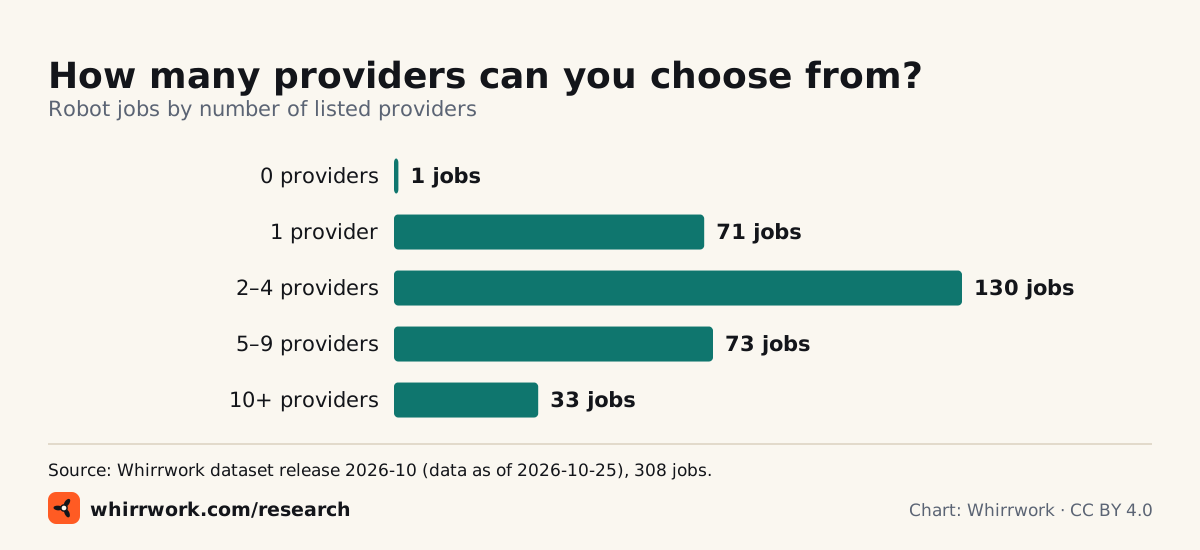
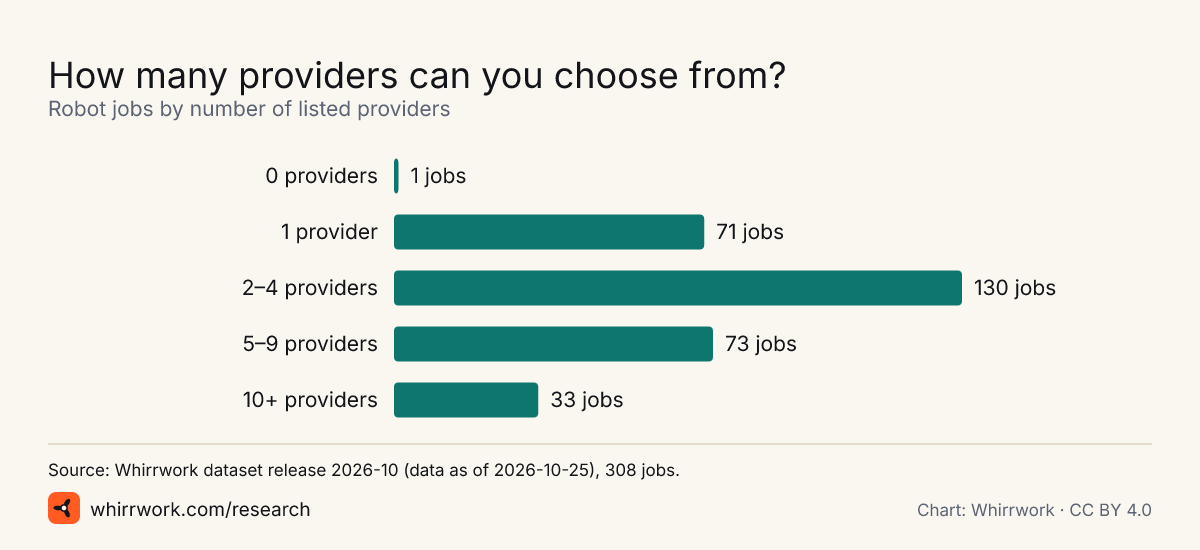
<a href="https://whirrwork.com/press/#chart-whirrwork-jobs-by-provider-count"><img src="https://whirrwork.com/research/charts/whirrwork-jobs-by-provider-count.svg" width="1200" height="550" alt="Bar chart of robot jobs by provider count: 0 providers: 1 jobs; 1 providers: 71 jobs; 2–4 providers: 130 jobs; 5–9 providers: 73 jobs; 10+ providers: 33 jobs."></a>
<p>Chart: <a href="https://whirrwork.com/research/">Whirrwork</a>, CC BY 4.0. Data: Whirrwork dataset release 2026-10 (data as of 2026-10-25), 308 jobs.</p>
로봇 대 사람 계산기: 일을 로봇이 할 때와 사람이 할 때의 비용을 추세와 전망과 함께 비교해 보세요.
데이터에서 나온 기사 아이디어
America passes Japan on the robot league table
In 2025 the US installed more industrial robots than Japan, which fell to third place behind China and the US, according to the IFR. Which industries drove it, and does reshoring show up in robot orders?
38,428 units (International Federation of Robotics (IFR)) · 36,219 units (International Federation of Robotics (IFR)) · 36,766 (US$2.25bn) robots (Association for Advancing Automation)
China builds and buys most of the world’s robots
China installs more industrial robots than the rest of the top five combined, and Chinese makers now supply over half of its own market.
354,226 units (International Federation of Robotics (IFR)) · 55% percent (International Federation of Robotics (IFR)) · 2,027,200 vs 393,700 units (International Federation of Robotics (IFR))
Crop-spraying drones got cheaper, fast
US farmers paid far less per acre for drone spraying in 2025 while sprayed acreage rose. Who is flying them, and what happened to new drone sales?
$13 USD per acre (American Spray Drone Coalition) · over 16.4 million acres (American Spray Drone Coalition) · ~3,711 units (approx., estimate) (American Spray Drone Coalition)
How many humanoid robots are there, really?
The IFR counts almost 6,900 humanoids sold in 2025; an analyst estimate reported in the press was about twice that. The gap is about definitions, and it matters for every “humanoid boom” headline.
almost 6,900 units (approx.) (International Federation of Robotics (IFR)) · about 13,000 units (approx., analyst estimate) (TechNode) · 1,079 units (HKEXnews (Hong Kong Exchanges and Clearing))
What a humanoid robot costs to buy, rent or subscribe to
List prices now start in the low thousands of dollars, and you can rent one by the day. A price guide with sources.
from $4,900 USD (list price) (Unitree Robotics (online shop)) · from $13,500 USD (list price) (Unitree Robotics) · $20,000 or $499/month USD (1X Technologies) · from US$449/day USD per day (Tempo Robots)
Most robot work still has no price tag
Whirrwork’s dataset shows most robot jobs and most providers publish no price at all. Why the robot-services market still runs on “contact us”.
71% percent of jobs (Whirrwork) · 14% percent of providers (Whirrwork)
Labour shortages, not hype, may be the real robot driver
Record labour-shortage bankruptcies in Japan, hundreds of thousands of unfilled jobs in Korea, and most US contractors with craft workers reporting open craft jobs.
427 bankruptcies (Teikoku Databank (TDB)) · 467,000 (2.4%) workers (e-나라지표 (index.go.kr)) · 88% percent of firms (AGC of America)
Robotics money is back
Robotics start-ups raised more in the first half of 2026 than in all of 2025, according to Crunchbase data. Who is getting it, and who went bust?
$18.8 billion USD (venture funding) (Crunchbase) · $15 billion USD (venture funding) (Crunchbase) · 14 Dec 2025 date (iRobot Corporation)
Korea: the most automated factory workforce on earth
South Korea has 1,220 robots per 10,000 manufacturing workers, far ahead of every other country. What it looks like on the factory floor.
1,220 robots per 10,000 manufacturing employees (International Federation of Robotics (IFR)) · 818 robots per 10,000 manufacturing employees (International Federation of Robotics (IFR)) · 307 robots per 10,000 manufacturing employees (International Federation of Robotics (IFR))
The drone-delivery numbers are getting real
Walmart’s million deliveries, millions of sidewalk-robot deliveries, and robotaxi rides by the hundred thousand a week. Which services are scaling, and where?
more than one million deliveries (cumulative, lower bound) (Walmart Inc.) · 9+ million deliveries (cumulative, lower bound) (Starship Technologies) · 500,000 paid rides per week (TechCrunch)
Whirrwork 인용 방법
Source: Whirrwork (https://whirrwork.com), CC BY 4.0
Each statistic and report has APA, Chicago, MLA and BibTeX citations on its own page. For third-party figures, credit the original source too.
라이선스와 출처 표시
글, 통계 페이지, 차트, 데이터셋 릴리스는 크리에이티브 커먼즈 저작자표시 4.0(CC BY 4.0) 라이선스로 제공됩니다. 인용한 문구의 권리는 각 발행처에 있으며, 제3자 수치는 원출처도 함께 밝혀 주세요.
출처 표시 문구: Source: Whirrwork (https://whirrwork.com), CC BY 4.0 · CC BY 4.0