Whirrwork Research
Pers dan kit media
Siapa kami, bagaimana data dikumpulkan, lembar fakta, logo, grafik yang bisa disematkan, dan ide liputan dari data.
Pernyataan statistik, kutipan, dan teks laporan berbahasa Inggris, bahasa yang kami gunakan untuk memverifikasinya. Navigasi di halaman ini diterjemahkan secara otomatis.
Siapa kami
Whirrwork adalah direktori global gratis berisi pekerjaan robot, penyedia layanan robot, dan harga dari sumber publik. Direktori ini membantu orang memutuskan apakah mereka memang butuh robot, dan berapa biaya pekerjaannya.
Whirrwork gratis bagi pembeli: tanpa biaya pembeli dan tanpa bayar untuk peringkat. Pemasok didaftarkan gratis. Kami tidak memakai pelacak iklan dan tidak menjual data.
Bagaimana data dikumpulkan
Penyedia dan harga dihimpun dari sumber publik: situs perusahaan, daftar tarif yang diterbitkan, tender publik, layanan penyuluhan, dan regulator. Setiap harga ditautkan ke halaman yang menyebutkannya, lengkap dengan tanggal. Statistik eksternal diperiksa ulang ke sumbernya sebelum terbit.
Lembar fakta
Data release 2026-10, as of Oct 25, 2026.
| Robot jobs tracked | 308 |
|---|---|
| Providers listed | 681 |
| Countries covered | 65 |
| Sourced price points | 302 |
| Jobs with no public price | 71% |
| Citable statistics | 115 |
| Languages | 13 |
| Price for buyers | Free |
Kontak pers
Untuk pertanyaan data, koreksi, atau wawancara, gunakan formulir kontak kami: pilih opsi untuk menyarankan koreksi dan tulis nama media Anda di kolom perusahaan. Setiap pesan dibaca oleh manusia.
Press email: press@whirrwork.com
Logo
Logo dapat dipakai di latar terang maupun gelap. Sisakan ruang kosong di semua sisi selebar lingkaran tengah; ukuran minimum 20 px untuk simbol dan 96 px untuk logo lengkap. Mohon jangan memutar simbol, mengganti warna baling-baling, menambahkan wajah pada robot (menggoda, kami tahu), atau menaruh simbol oranye di atas oranye.




Grafik
Setiap grafik dibuat dari data dan memuat baris sumber di dalam gambar. Sematkan dengan kode di bawah atau unduh dalam SVG atau PNG.
Kode sematan
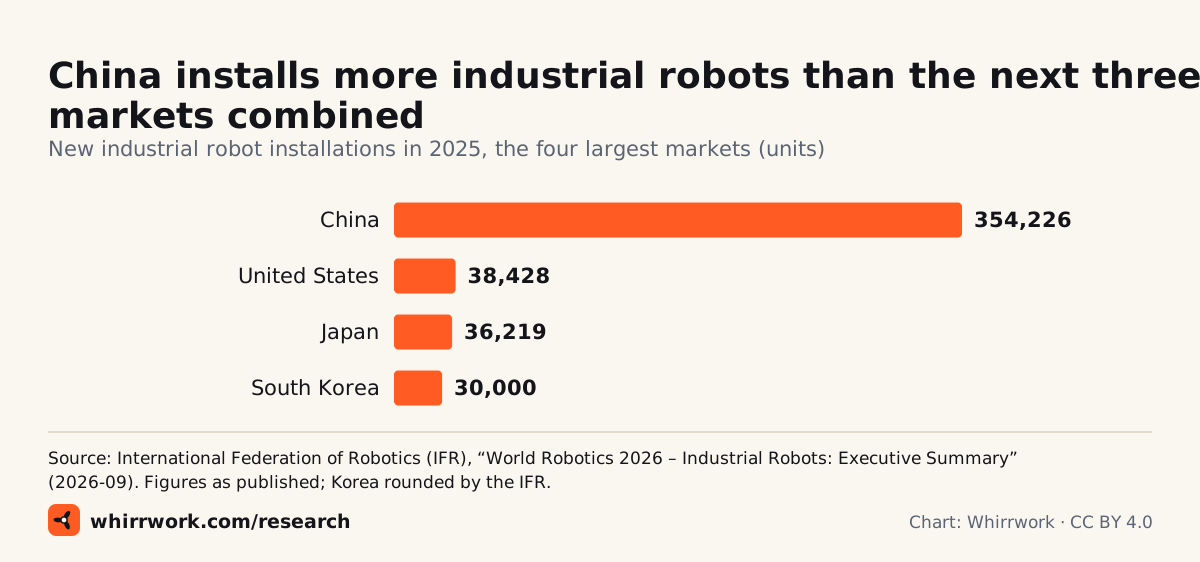
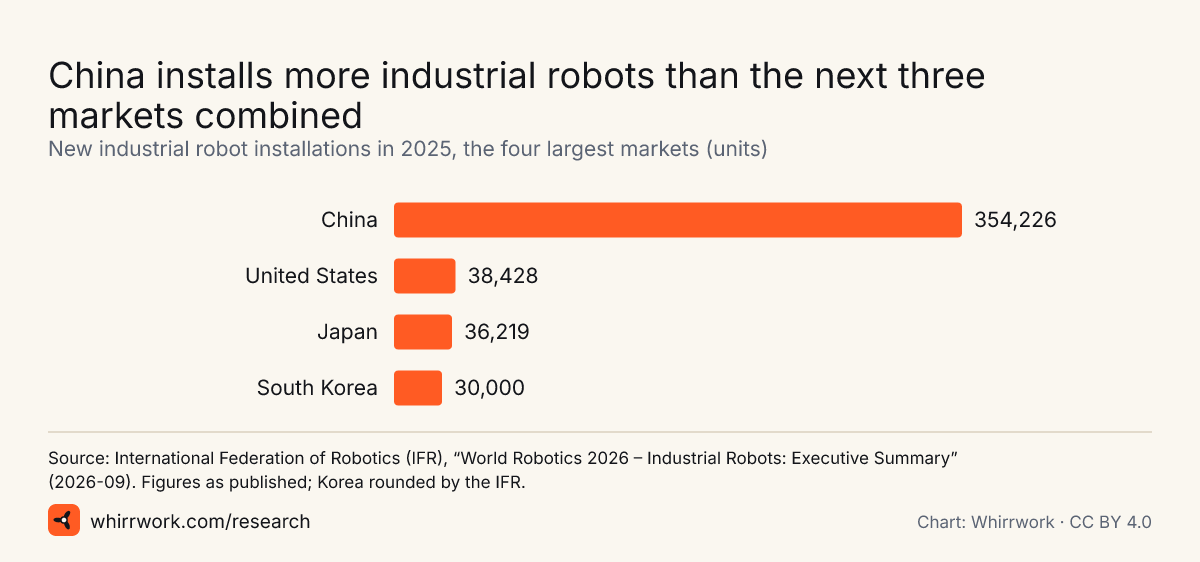
<a href="https://whirrwork.com/press/#chart-ifr-industrial-robot-installations-top-markets-2025"><img src="https://whirrwork.com/research/charts/ifr-industrial-robot-installations-top-markets-2025.svg" width="1200" height="562" alt="Bar chart of 2025 industrial robot installations: China 354,226, United States 38,428, Japan 36,219, Republic of Korea 30,000."></a>
<p>Chart: <a href="https://whirrwork.com/research/">Whirrwork</a>, CC BY 4.0. Data: International Federation of Robotics (IFR), “World Robotics 2026 – Industrial Robots: Executive Summary” (2026-09). Figures as published; Korea rounded by the IFR.</p>
Kode sematan
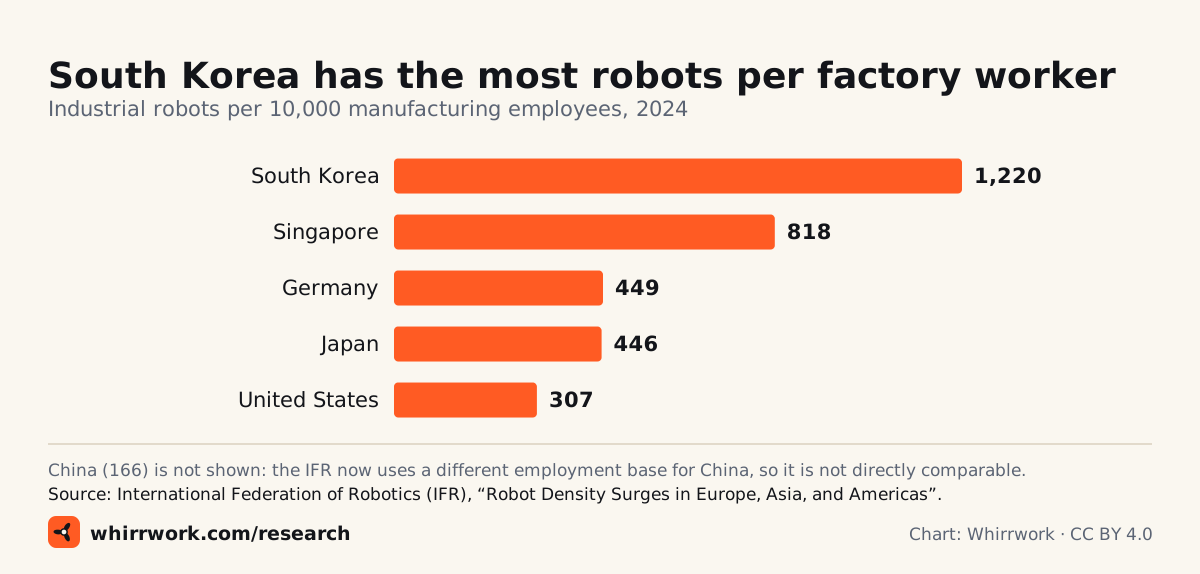
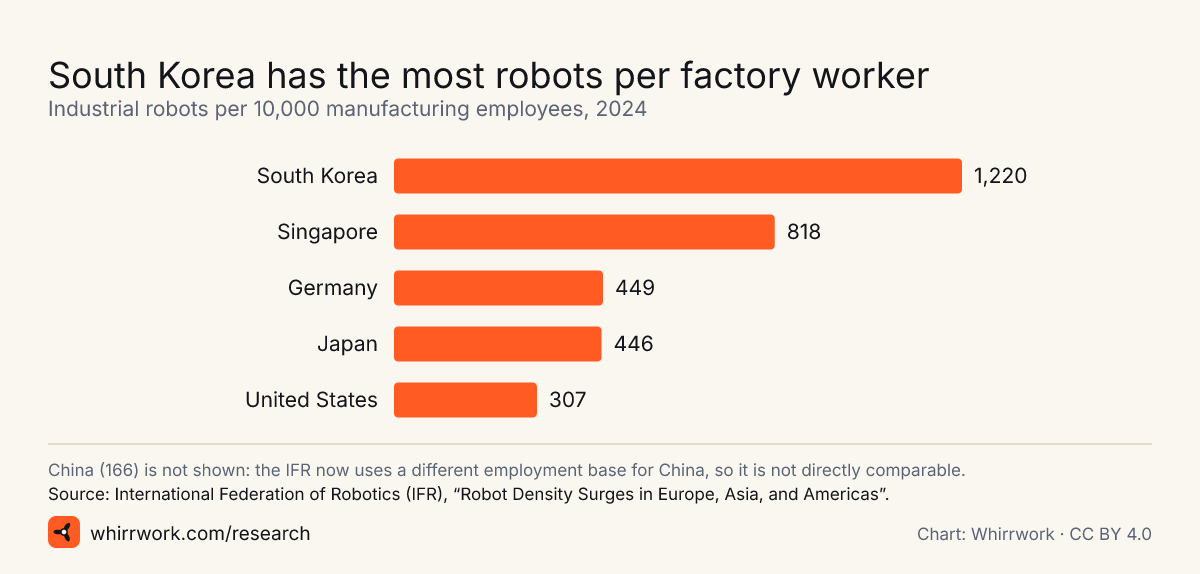
<a href="https://whirrwork.com/press/#chart-ifr-robot-density-2024"><img src="https://whirrwork.com/research/charts/ifr-robot-density-2024.svg" width="1200" height="574" alt="Bar chart of robot density in 2024: Republic of Korea 1,220, Singapore 818, Germany 449, Japan 446, United States 307 robots per 10,000 manufacturing employees."></a>
<p>Chart: <a href="https://whirrwork.com/research/">Whirrwork</a>, CC BY 4.0. Data: International Federation of Robotics (IFR), “Robot Density Surges in Europe, Asia, and Americas”.</p>
Kode sematan
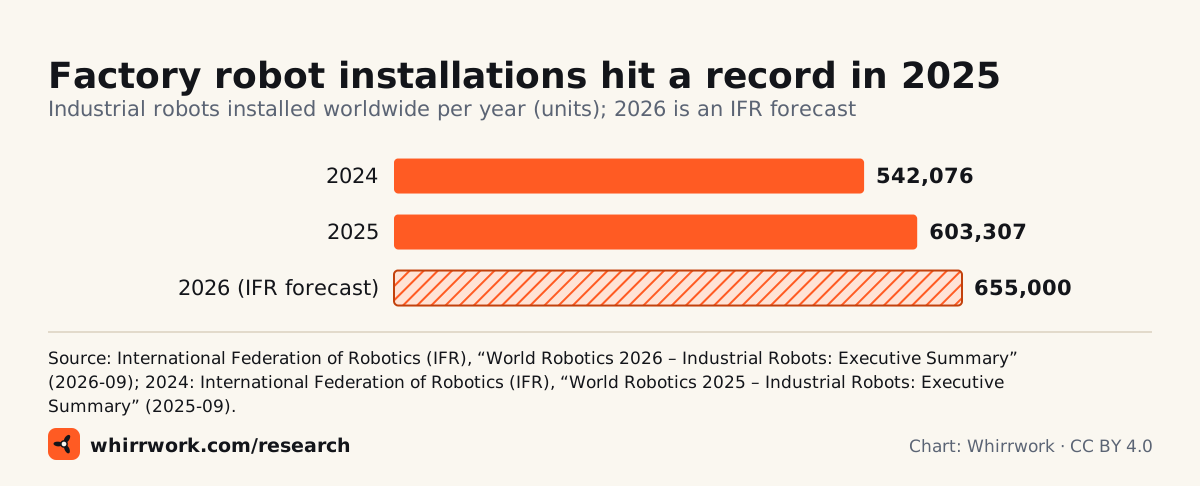
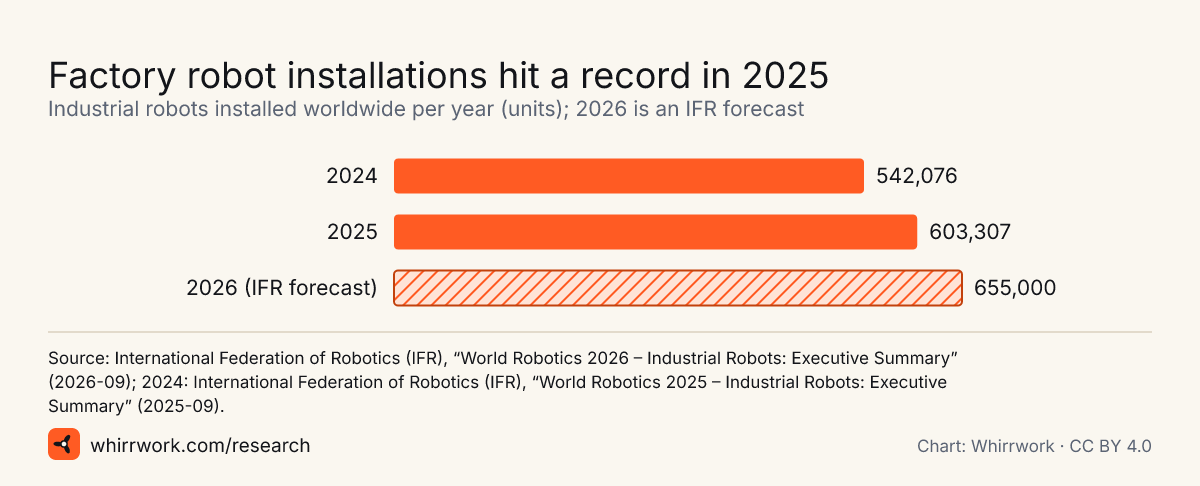
<a href="https://whirrwork.com/press/#chart-ifr-world-industrial-robot-installations-2024-2026"><img src="https://whirrwork.com/research/charts/ifr-world-industrial-robot-installations-2024-2026.svg" width="1200" height="486" alt="Bar chart: 542,076 industrial robots installed in 2024, 603,307 in 2025, and an IFR forecast of 655,000 for 2026."></a>
<p>Chart: <a href="https://whirrwork.com/research/">Whirrwork</a>, CC BY 4.0. Data: International Federation of Robotics (IFR), “World Robotics 2026 – Industrial Robots: Executive Summary” (2026-09); 2024: International Federation of Robotics (IFR), “World Robotics 2025 – Industrial Robots: Executive Summary” (2025-09).</p>
Kode sematan
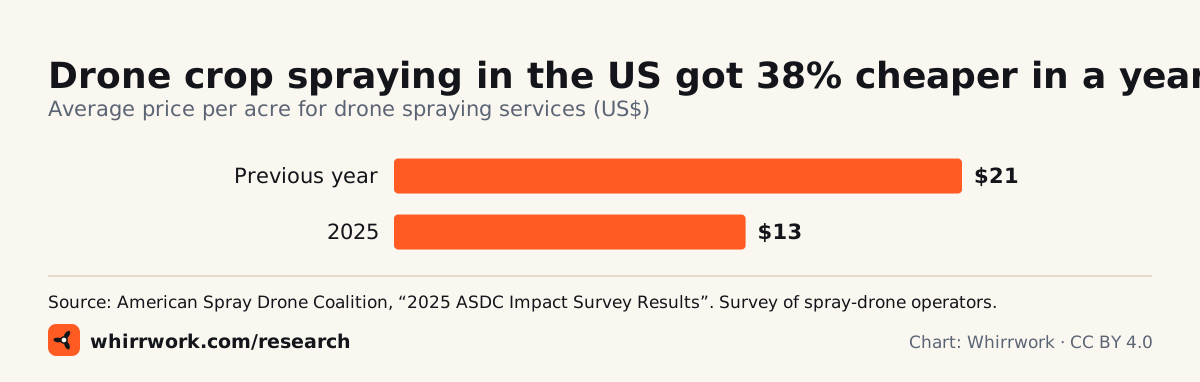
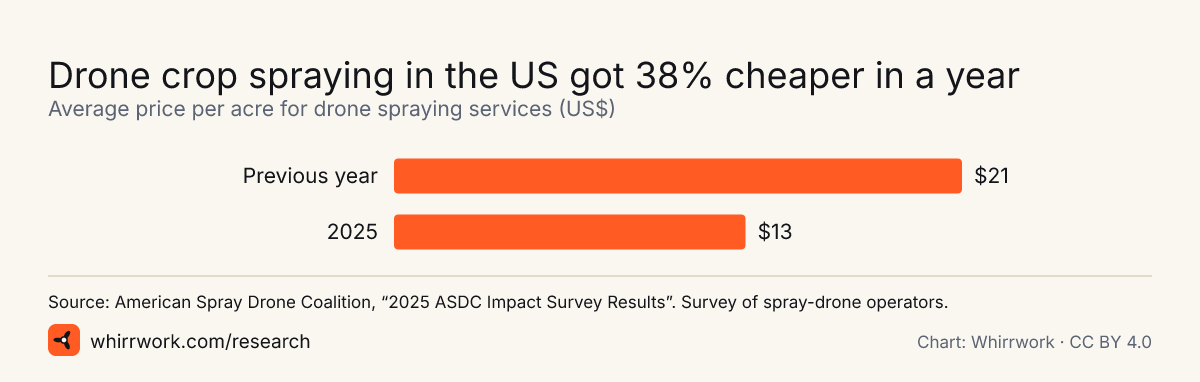
<a href="https://whirrwork.com/press/#chart-asdc-us-drone-spraying-price-per-acre"><img src="https://whirrwork.com/research/charts/asdc-us-drone-spraying-price-per-acre.svg" width="1200" height="382" alt="Bar chart: average US drone spraying price per acre, Previous year $21, 2025 $13."></a>
<p>Chart: <a href="https://whirrwork.com/research/">Whirrwork</a>, CC BY 4.0. Data: American Spray Drone Coalition, “2025 ASDC Impact Survey Results”. Survey of spray-drone operators.</p>
Kode sematan
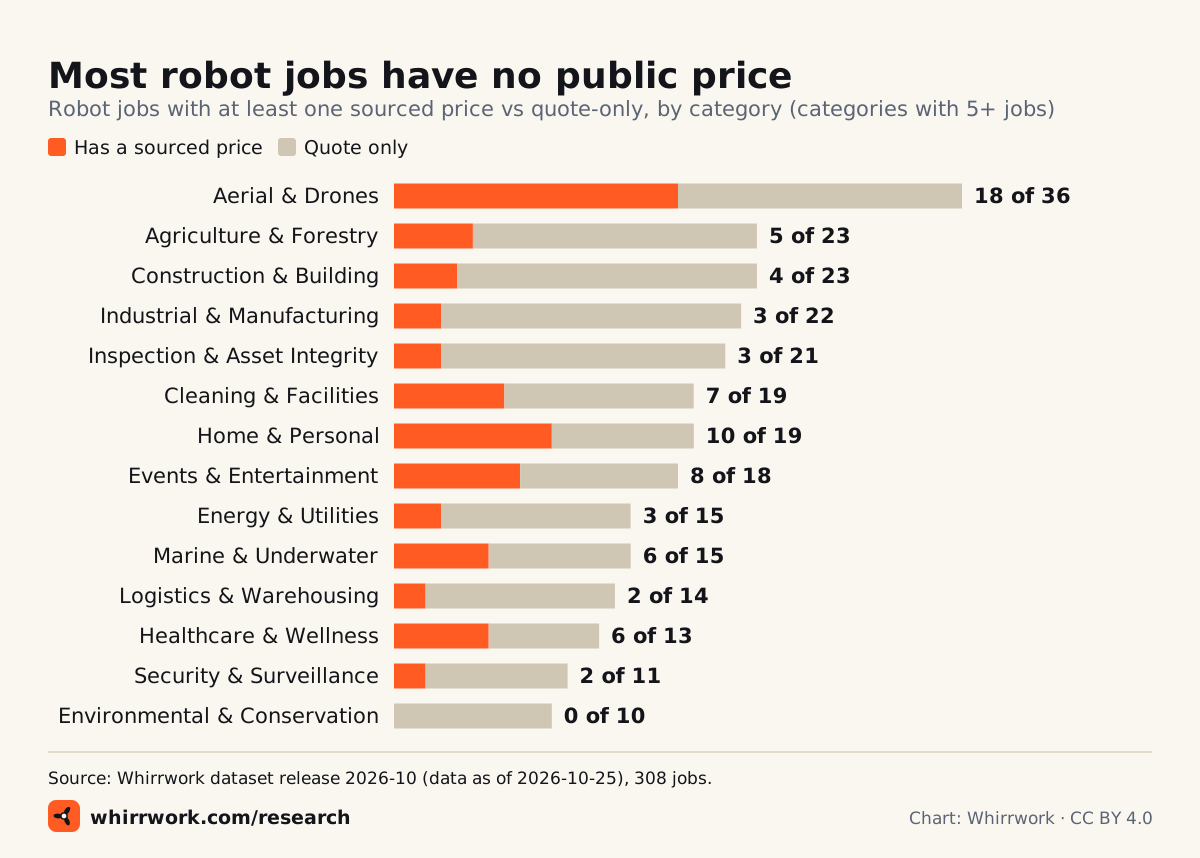
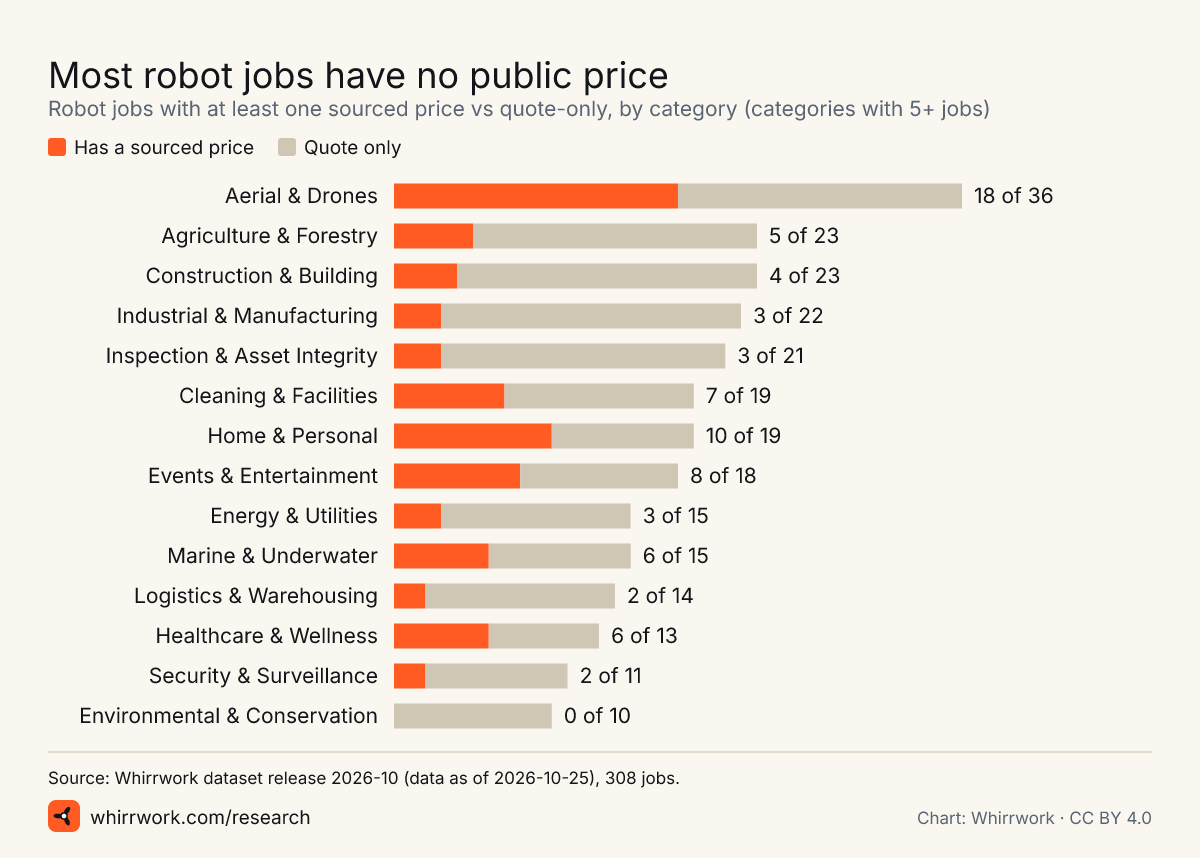
<a href="https://whirrwork.com/press/#chart-whirrwork-priced-jobs-by-category"><img src="https://whirrwork.com/research/charts/whirrwork-priced-jobs-by-category.svg" width="1200" height="858" alt="Stacked bar chart of robot jobs with a public price by category. Overall 88 of 308 jobs have a sourced price."></a>
<p>Chart: <a href="https://whirrwork.com/research/">Whirrwork</a>, CC BY 4.0. Data: Whirrwork dataset release 2026-10 (data as of 2026-10-25), 308 jobs.</p>
Kode sematan
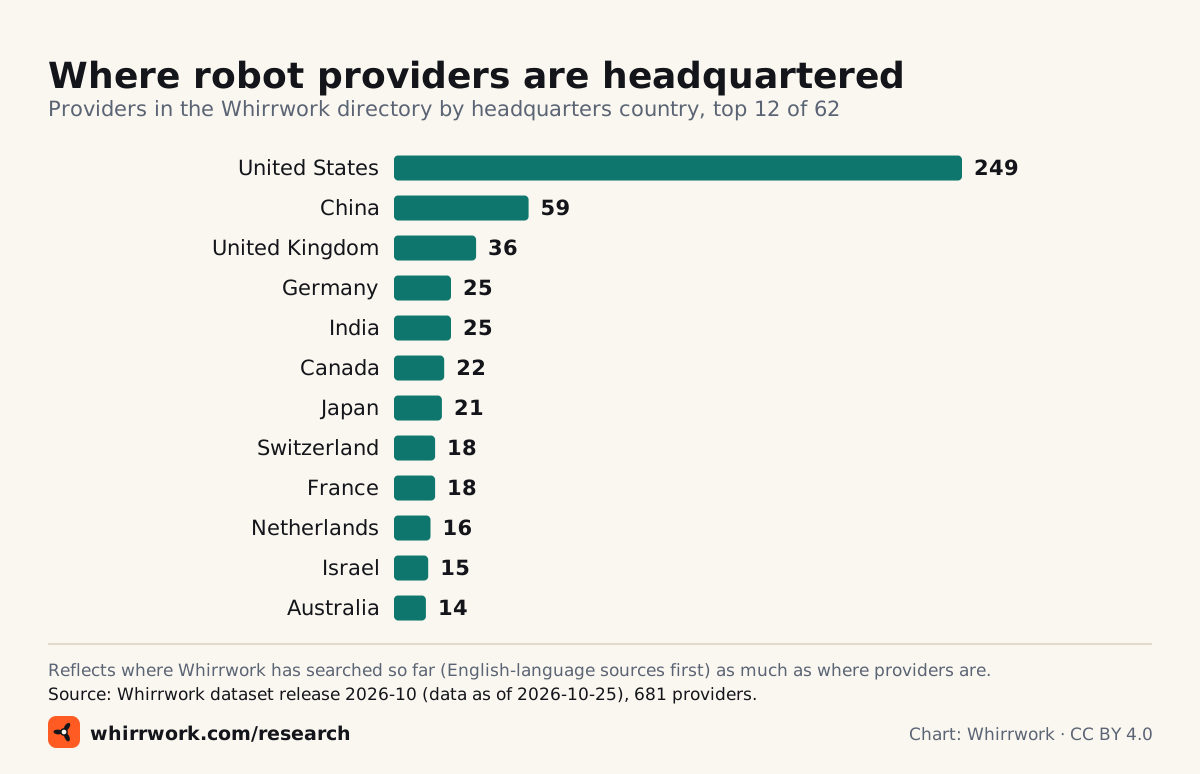
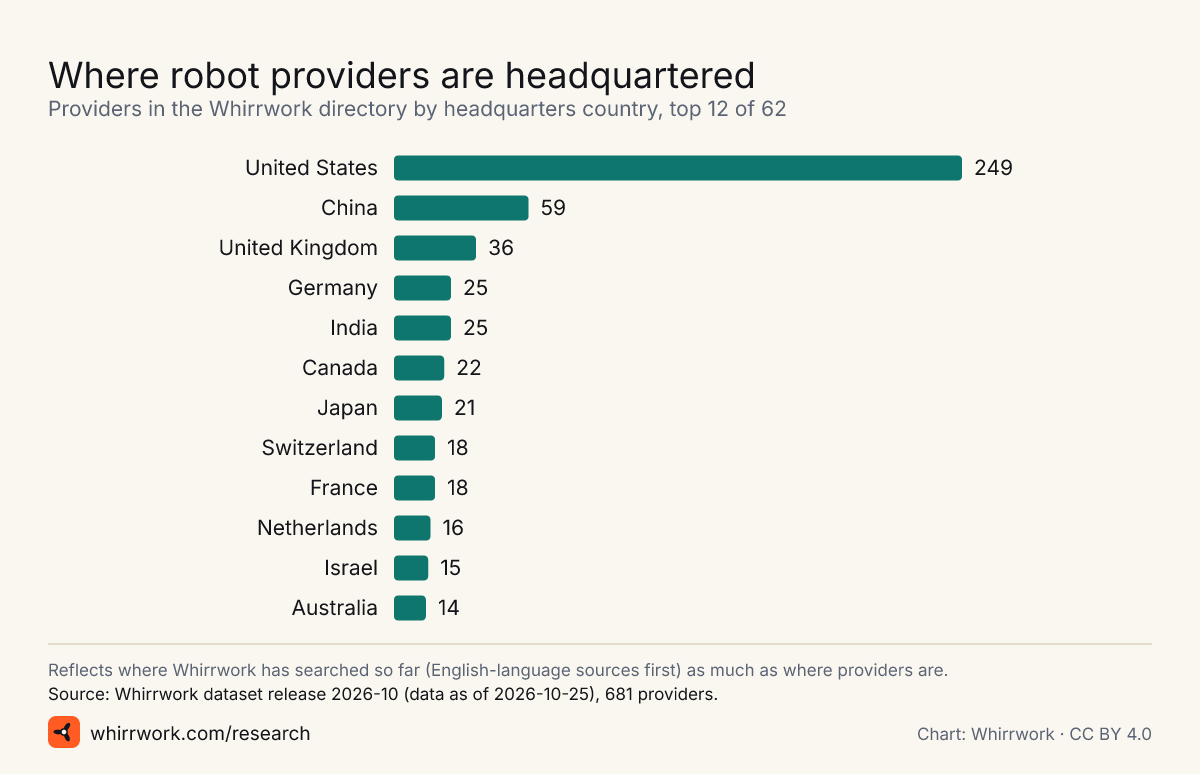
<a href="https://whirrwork.com/press/#chart-whirrwork-providers-by-hq-country"><img src="https://whirrwork.com/research/charts/whirrwork-providers-by-hq-country.svg" width="1200" height="774" alt="Bar chart of providers by headquarters country: United States 249, China 59, United Kingdom 36, Germany 25, India 25, and more."></a>
<p>Chart: <a href="https://whirrwork.com/research/">Whirrwork</a>, CC BY 4.0. Data: Whirrwork dataset release 2026-10 (data as of 2026-10-25), 681 providers.</p>
Kode sematan
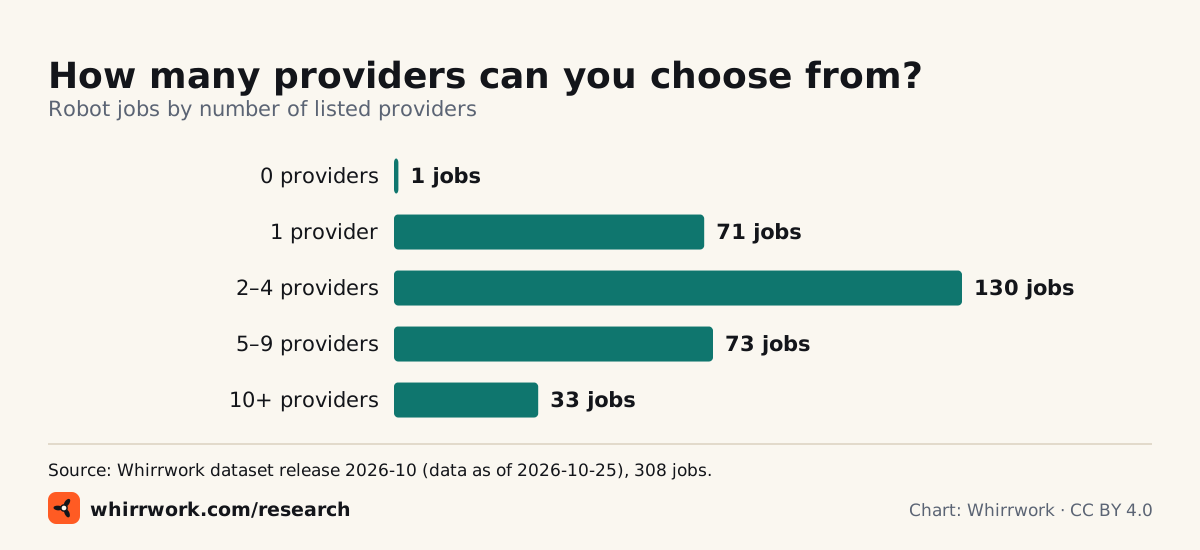
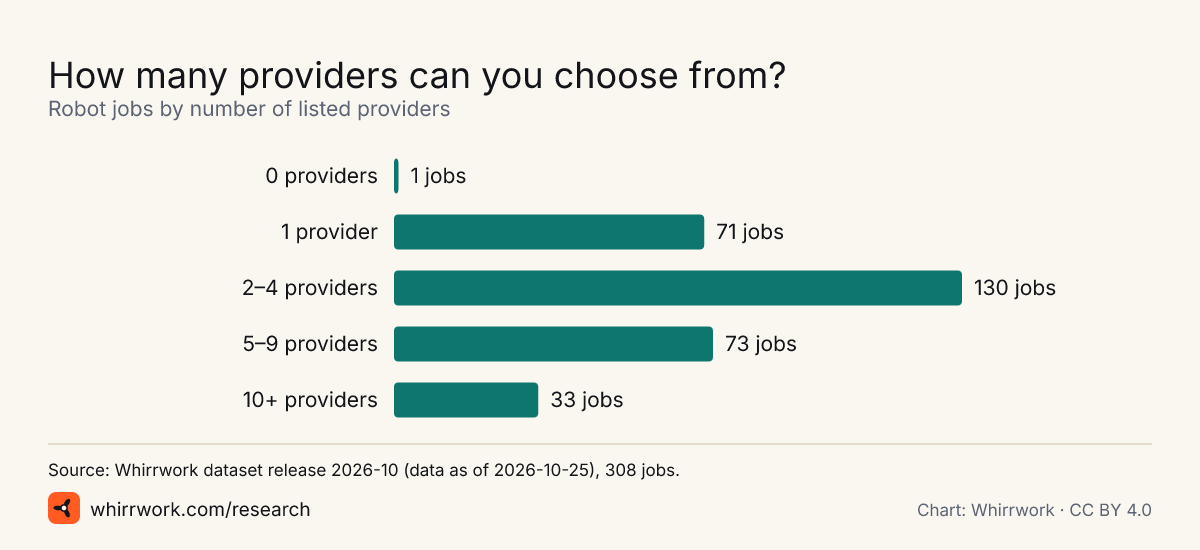
<a href="https://whirrwork.com/press/#chart-whirrwork-jobs-by-provider-count"><img src="https://whirrwork.com/research/charts/whirrwork-jobs-by-provider-count.svg" width="1200" height="550" alt="Bar chart of robot jobs by provider count: 0 providers: 1 jobs; 1 providers: 71 jobs; 2–4 providers: 130 jobs; 5–9 providers: 73 jobs; 10+ providers: 33 jobs."></a>
<p>Chart: <a href="https://whirrwork.com/research/">Whirrwork</a>, CC BY 4.0. Data: Whirrwork dataset release 2026-10 (data as of 2026-10-25), 308 jobs.</p>
Kalkulator robot atau manusia?: Bandingkan biaya sebuah pekerjaan bila dikerjakan robot atau manusia, lengkap dengan tren dan proyeksi.
Ide liputan dari data
America passes Japan on the robot league table
In 2025 the US installed more industrial robots than Japan, which fell to third place behind China and the US, according to the IFR. Which industries drove it, and does reshoring show up in robot orders?
38,428 units (International Federation of Robotics (IFR)) · 36,219 units (International Federation of Robotics (IFR)) · 36,766 (US$2.25bn) robots (Association for Advancing Automation)
China builds and buys most of the world’s robots
China installs more industrial robots than the rest of the top five combined, and Chinese makers now supply over half of its own market.
354,226 units (International Federation of Robotics (IFR)) · 55% percent (International Federation of Robotics (IFR)) · 2,027,200 vs 393,700 units (International Federation of Robotics (IFR))
Crop-spraying drones got cheaper, fast
US farmers paid far less per acre for drone spraying in 2025 while sprayed acreage rose. Who is flying them, and what happened to new drone sales?
$13 USD per acre (American Spray Drone Coalition) · over 16.4 million acres (American Spray Drone Coalition) · ~3,711 units (approx., estimate) (American Spray Drone Coalition)
How many humanoid robots are there, really?
The IFR counts almost 6,900 humanoids sold in 2025; an analyst estimate reported in the press was about twice that. The gap is about definitions, and it matters for every “humanoid boom” headline.
almost 6,900 units (approx.) (International Federation of Robotics (IFR)) · about 13,000 units (approx., analyst estimate) (TechNode) · 1,079 units (HKEXnews (Hong Kong Exchanges and Clearing))
What a humanoid robot costs to buy, rent or subscribe to
List prices now start in the low thousands of dollars, and you can rent one by the day. A price guide with sources.
from $4,900 USD (list price) (Unitree Robotics (online shop)) · from $13,500 USD (list price) (Unitree Robotics) · $20,000 or $499/month USD (1X Technologies) · from US$449/day USD per day (Tempo Robots)
Most robot work still has no price tag
Whirrwork’s dataset shows most robot jobs and most providers publish no price at all. Why the robot-services market still runs on “contact us”.
71% percent of jobs (Whirrwork) · 14% percent of providers (Whirrwork)
Labour shortages, not hype, may be the real robot driver
Record labour-shortage bankruptcies in Japan, hundreds of thousands of unfilled jobs in Korea, and most US contractors with craft workers reporting open craft jobs.
427 bankruptcies (Teikoku Databank (TDB)) · 467,000 (2.4%) workers (e-나라지표 (index.go.kr)) · 88% percent of firms (AGC of America)
Robotics money is back
Robotics start-ups raised more in the first half of 2026 than in all of 2025, according to Crunchbase data. Who is getting it, and who went bust?
$18.8 billion USD (venture funding) (Crunchbase) · $15 billion USD (venture funding) (Crunchbase) · 14 Dec 2025 date (iRobot Corporation)
Korea: the most automated factory workforce on earth
South Korea has 1,220 robots per 10,000 manufacturing workers, far ahead of every other country. What it looks like on the factory floor.
1,220 robots per 10,000 manufacturing employees (International Federation of Robotics (IFR)) · 818 robots per 10,000 manufacturing employees (International Federation of Robotics (IFR)) · 307 robots per 10,000 manufacturing employees (International Federation of Robotics (IFR))
The drone-delivery numbers are getting real
Walmart’s million deliveries, millions of sidewalk-robot deliveries, and robotaxi rides by the hundred thousand a week. Which services are scaling, and where?
more than one million deliveries (cumulative, lower bound) (Walmart Inc.) · 9+ million deliveries (cumulative, lower bound) (Starship Technologies) · 500,000 paid rides per week (TechCrunch)
Cara mengutip Whirrwork
Source: Whirrwork (https://whirrwork.com), CC BY 4.0
Each statistic and report has APA, Chicago, MLA and BibTeX citations on its own page. For third-party figures, credit the original source too.
Lisensi dan atribusi
Teks, halaman statistik, grafik, dan rilis dataset dilisensikan di bawah Creative Commons Atribusi 4.0 (CC BY 4.0). Kutipan tetap menjadi milik penerbitnya, dan angka dari pihak ketiga juga harus dikreditkan ke sumber aslinya.
Teks atribusi: Source: Whirrwork (https://whirrwork.com), CC BY 4.0 · CC BY 4.0