Whirrwork Research
媒體資料包
我們是誰、資料如何收集、資料概覽、標誌、可嵌入的圖表,以及來自資料的選題建議。
統計表述、引文和報告正文為英文,這是我們核查時使用的語言。本頁的導航內容為自動翻譯。
我們是誰
Whirrwork 是一個免費的全球目錄,收錄機器人作業、機器人服務商和有公開出處的價格。它幫助人們判斷是否真的需要機器人,以及這項工作要花多少錢。
Whirrwork 對買家免費:不收買家費用,也沒有付費排名。供應商免費收錄。我們不使用廣告追蹤器,也不出售資料。
資料如何收集
服務商和價格均來自公開來源:企業網站、公開價目表、公開招標、農業推廣服務和監管機構。每個價格都連結到給出它的頁面並註明日期。外部統計在釋出前會對照來源再次核查。
資料概覽
Data release 2026-10, as of Oct 25, 2026.
| Robot jobs tracked | 308 |
|---|---|
| Providers listed | 681 |
| Countries covered | 65 |
| Sourced price points | 302 |
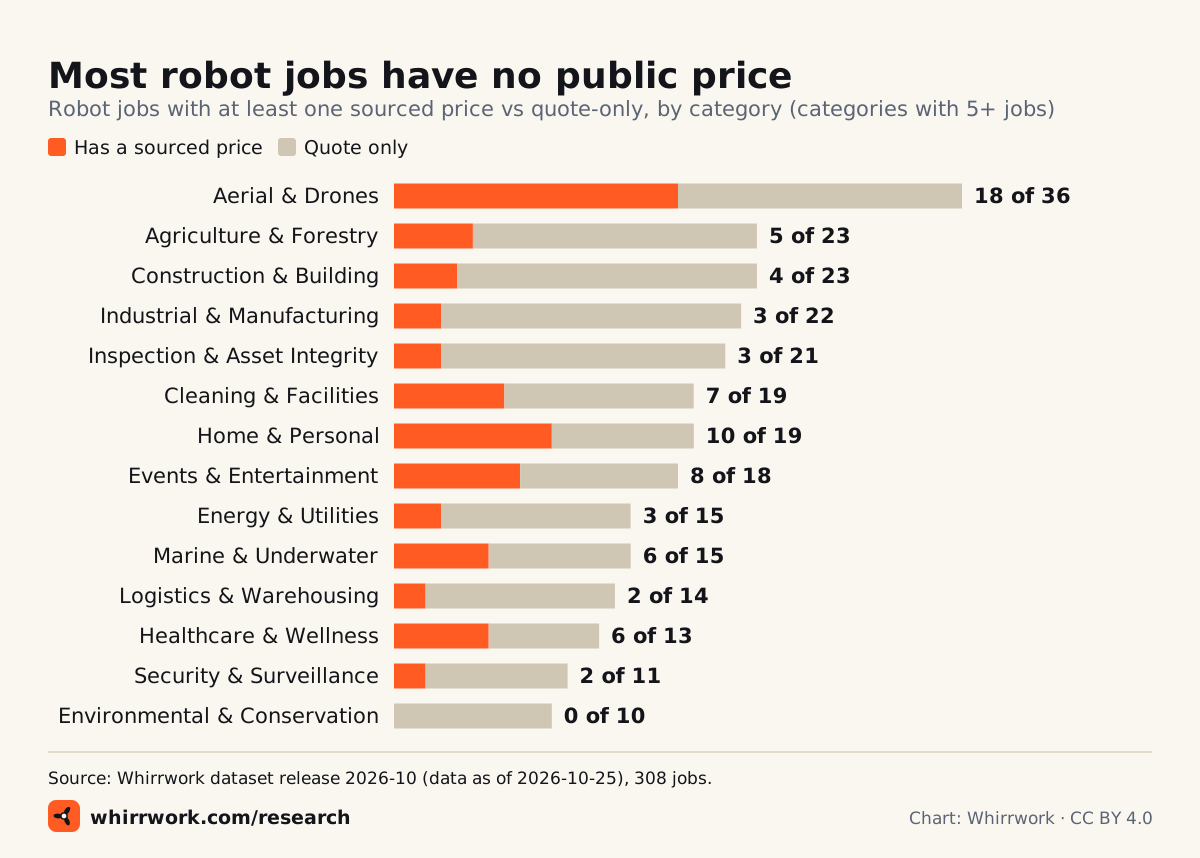
| Jobs with no public price | 71% |
| Citable statistics | 115 |
| Languages | 13 |
| Price for buyers | Free |
媒體聯絡
如有資料問題、更正或採訪需求,請使用我們的聯絡表單:選擇提出更正的選項,並在公司一欄填寫您的媒體名稱。每條訊息都有專人閱讀。
Press email: press@whirrwork.com
標誌
標誌適用於淺色或深色背景。四周請保留與中心圓同等大小的留白;圖形標誌最小 20 px,完整標誌最小 96 px。請不要旋轉圖形、給葉片改色、給機器人加上臉(我們知道很誘人),或把橙色標誌放在橙色底上。




圖表
每張圖表都由資料生成,圖片內帶有來源說明。可用下方程式碼嵌入,或下載 SVG、PNG 格式。
嵌入程式碼
Image:
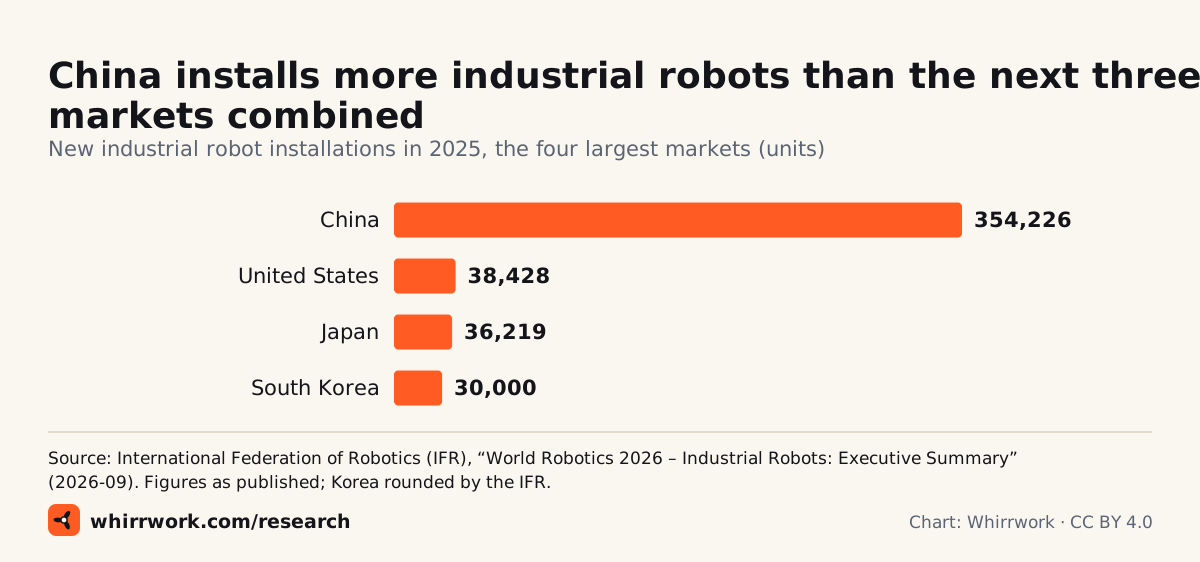
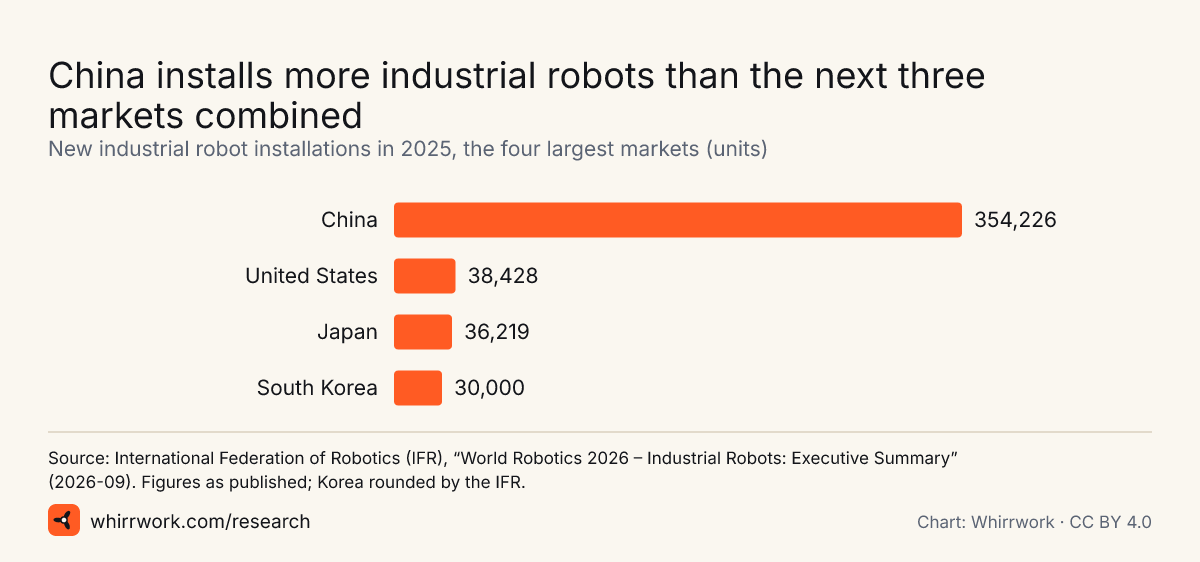
<a href="https://whirrwork.com/press/#chart-ifr-industrial-robot-installations-top-markets-2025"><img src="https://whirrwork.com/research/charts/ifr-industrial-robot-installations-top-markets-2025.svg" width="1200" height="562" alt="Bar chart of 2025 industrial robot installations: China 354,226, United States 38,428, Japan 36,219, Republic of Korea 30,000."></a>
<p>Chart: <a href="https://whirrwork.com/research/">Whirrwork</a>, CC BY 4.0. Data: International Federation of Robotics (IFR), “World Robotics 2026 – Industrial Robots: Executive Summary” (2026-09). Figures as published; Korea rounded by the IFR.</p>
Iframe (no cookies, no scripts):
<iframe src="https://whirrwork.com/embed/chart/ifr-industrial-robot-installations-top-markets-2025/" width="1200" height="562" style="border:0;width:100%;max-width:720px;height:auto;aspect-ratio:1200/562" loading="lazy" title="China installs more industrial robots than the next three markets combined (Whirrwork chart)"></iframe>
嵌入程式碼
Image:
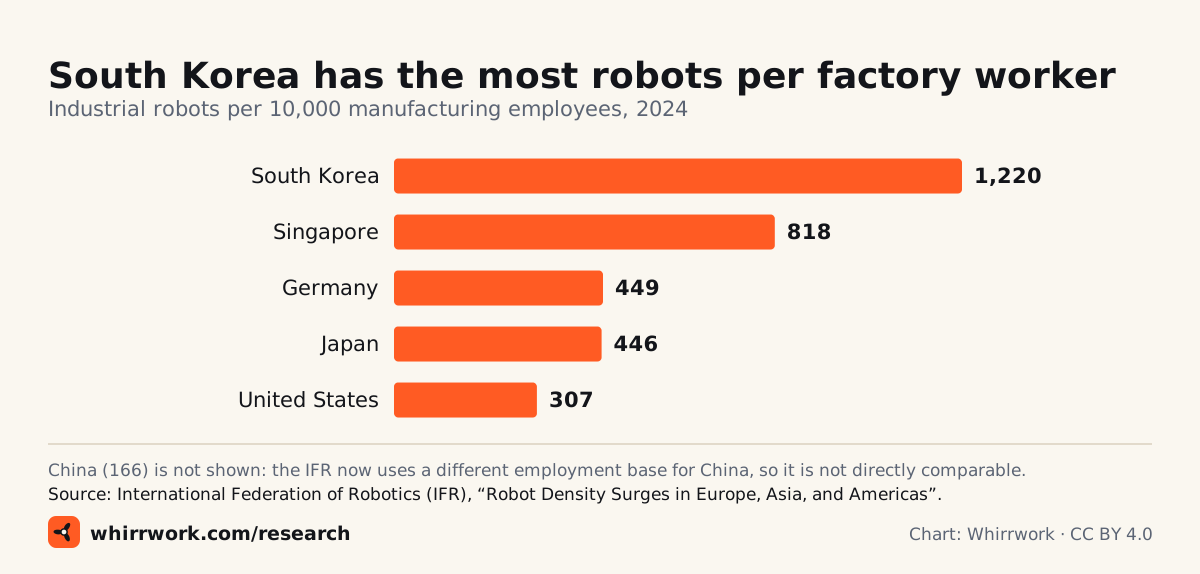
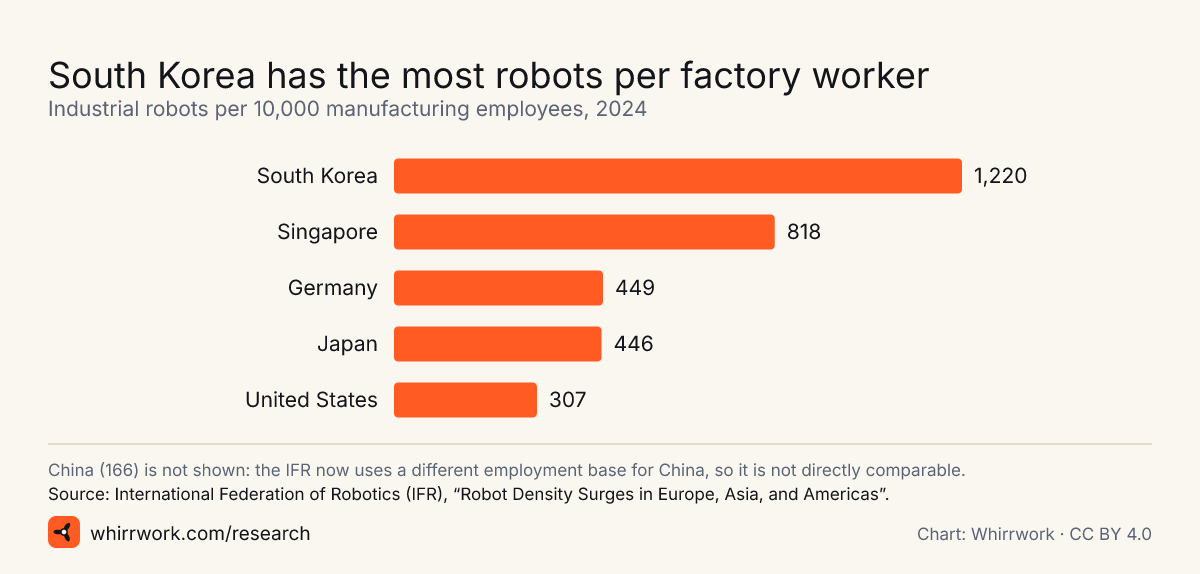
<a href="https://whirrwork.com/press/#chart-ifr-robot-density-2024"><img src="https://whirrwork.com/research/charts/ifr-robot-density-2024.svg" width="1200" height="574" alt="Bar chart of robot density in 2024: Republic of Korea 1,220, Singapore 818, Germany 449, Japan 446, United States 307 robots per 10,000 manufacturing employees."></a>
<p>Chart: <a href="https://whirrwork.com/research/">Whirrwork</a>, CC BY 4.0. Data: International Federation of Robotics (IFR), “Robot Density Surges in Europe, Asia, and Americas”.</p>
Iframe (no cookies, no scripts):
<iframe src="https://whirrwork.com/embed/chart/ifr-robot-density-2024/" width="1200" height="574" style="border:0;width:100%;max-width:720px;height:auto;aspect-ratio:1200/574" loading="lazy" title="South Korea has the most robots per factory worker (Whirrwork chart)"></iframe>
嵌入程式碼
Image:
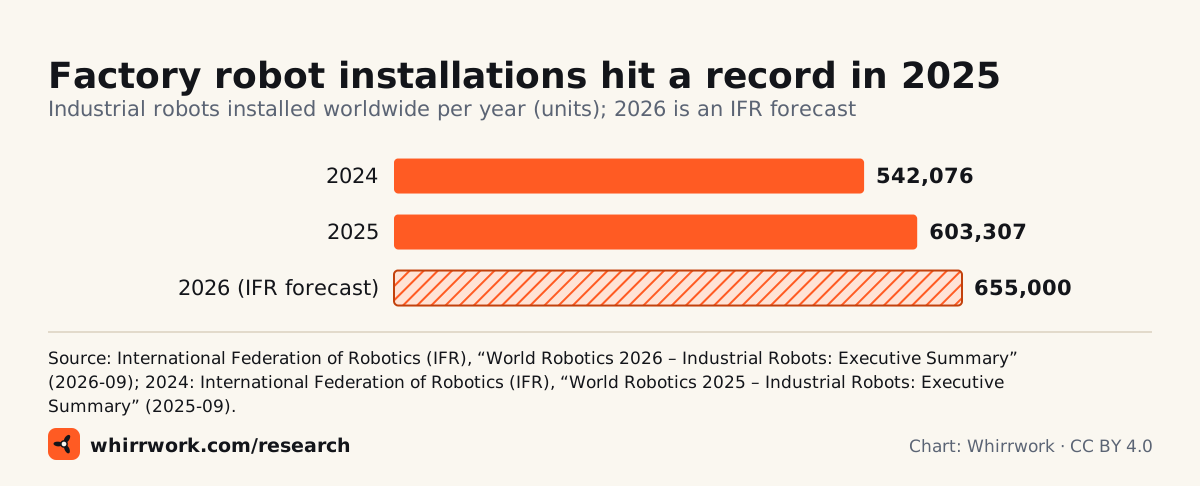
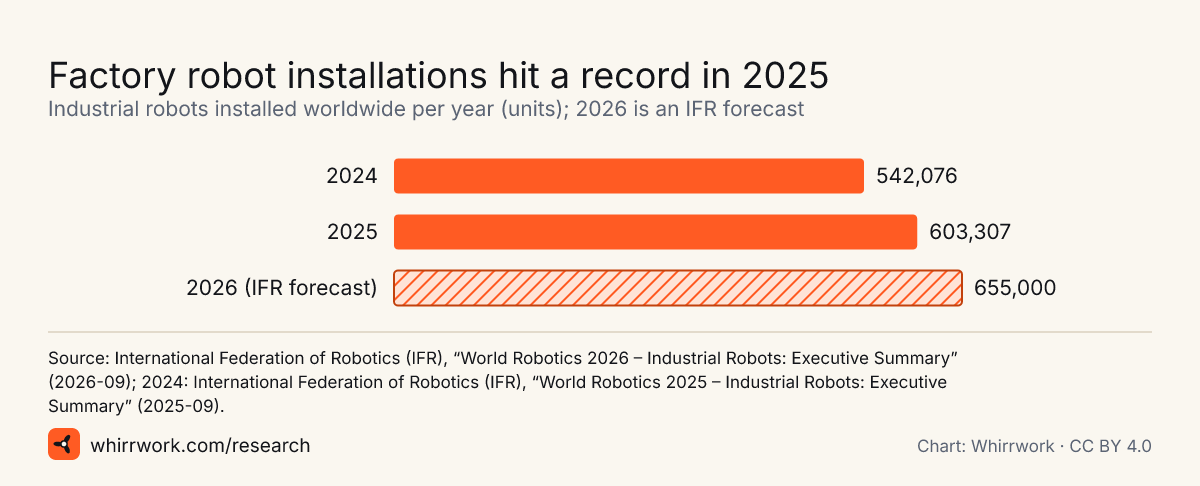
<a href="https://whirrwork.com/press/#chart-ifr-world-industrial-robot-installations-2024-2026"><img src="https://whirrwork.com/research/charts/ifr-world-industrial-robot-installations-2024-2026.svg" width="1200" height="486" alt="Bar chart: 542,076 industrial robots installed in 2024, 603,307 in 2025, and an IFR forecast of 655,000 for 2026."></a>
<p>Chart: <a href="https://whirrwork.com/research/">Whirrwork</a>, CC BY 4.0. Data: International Federation of Robotics (IFR), “World Robotics 2026 – Industrial Robots: Executive Summary” (2026-09); 2024: International Federation of Robotics (IFR), “World Robotics 2025 – Industrial Robots: Executive Summary” (2025-09).</p>
Iframe (no cookies, no scripts):
<iframe src="https://whirrwork.com/embed/chart/ifr-world-industrial-robot-installations-2024-2026/" width="1200" height="486" style="border:0;width:100%;max-width:720px;height:auto;aspect-ratio:1200/486" loading="lazy" title="Factory robot installations hit a record in 2025 (Whirrwork chart)"></iframe>
嵌入程式碼
Image:
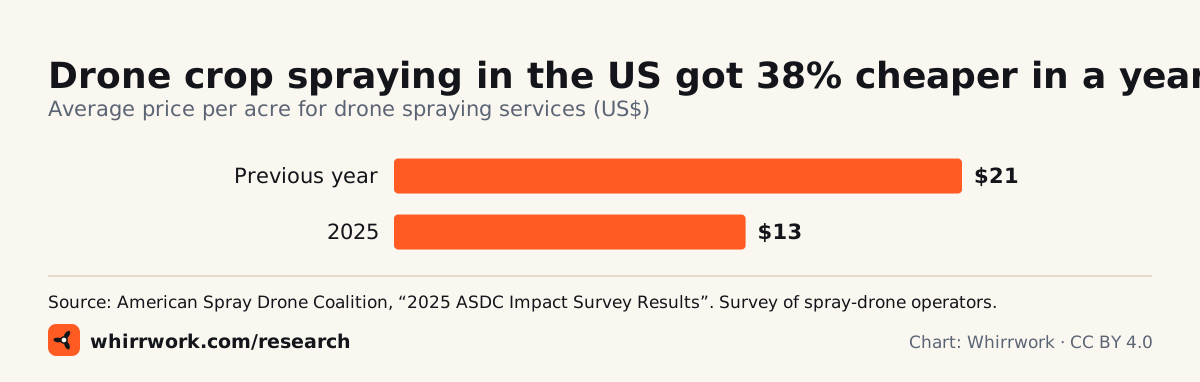
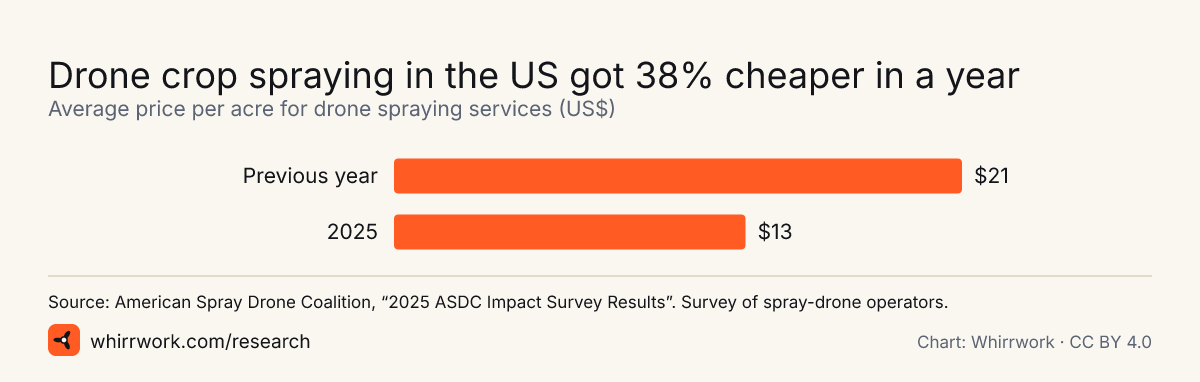
<a href="https://whirrwork.com/press/#chart-asdc-us-drone-spraying-price-per-acre"><img src="https://whirrwork.com/research/charts/asdc-us-drone-spraying-price-per-acre.svg" width="1200" height="382" alt="Bar chart: average US drone spraying price per acre, Previous year $21, 2025 $13."></a>
<p>Chart: <a href="https://whirrwork.com/research/">Whirrwork</a>, CC BY 4.0. Data: American Spray Drone Coalition, “2025 ASDC Impact Survey Results”. Survey of spray-drone operators.</p>
Iframe (no cookies, no scripts):
<iframe src="https://whirrwork.com/embed/chart/asdc-us-drone-spraying-price-per-acre/" width="1200" height="382" style="border:0;width:100%;max-width:720px;height:auto;aspect-ratio:1200/382" loading="lazy" title="Drone crop spraying in the US got 38% cheaper in a year (Whirrwork chart)"></iframe>
嵌入程式碼
Image:
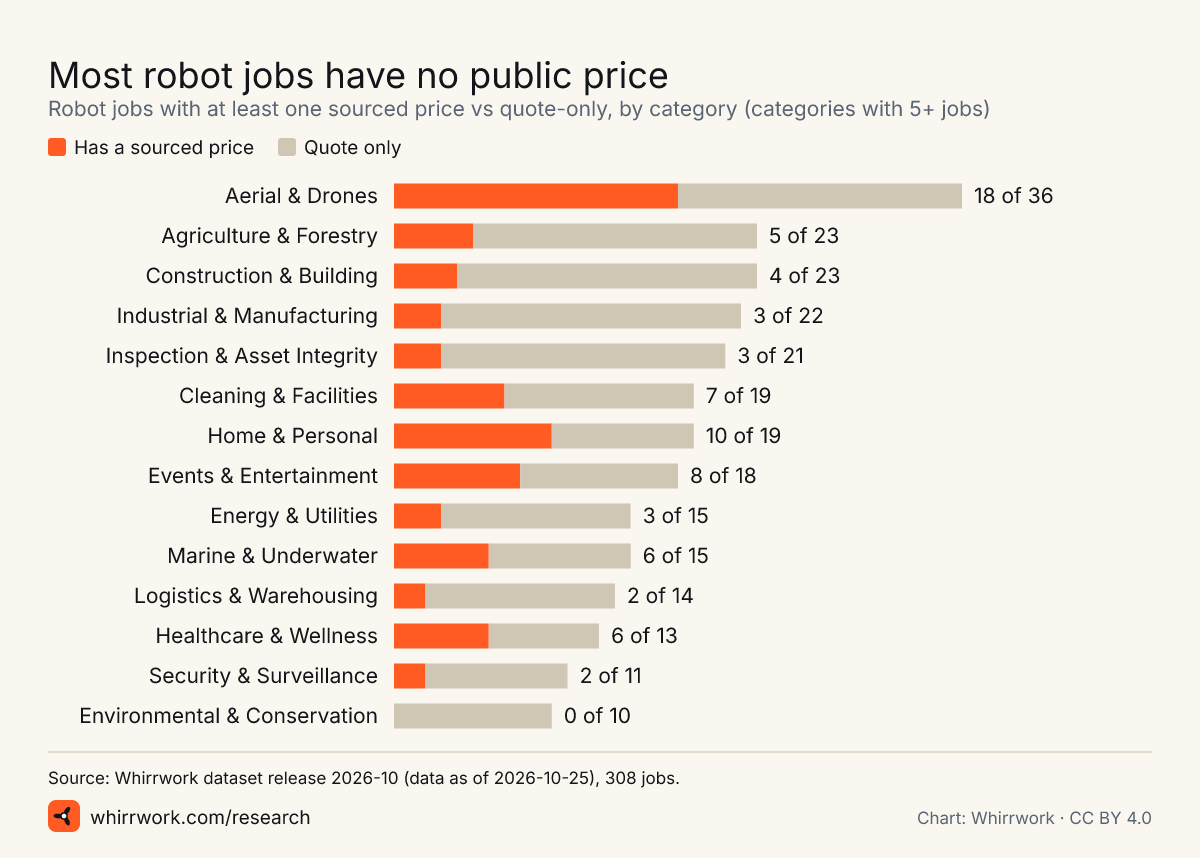
<a href="https://whirrwork.com/press/#chart-whirrwork-priced-jobs-by-category"><img src="https://whirrwork.com/research/charts/whirrwork-priced-jobs-by-category.svg" width="1200" height="858" alt="Stacked bar chart of robot jobs with a public price by category. Overall 88 of 308 jobs have a sourced price."></a>
<p>Chart: <a href="https://whirrwork.com/research/">Whirrwork</a>, CC BY 4.0. Data: Whirrwork dataset release 2026-10 (data as of 2026-10-25), 308 jobs.</p>
Iframe (no cookies, no scripts):
<iframe src="https://whirrwork.com/embed/chart/whirrwork-priced-jobs-by-category/" width="1200" height="858" style="border:0;width:100%;max-width:720px;height:auto;aspect-ratio:1200/858" loading="lazy" title="Most robot jobs have no public price (Whirrwork chart)"></iframe>
嵌入程式碼
Image:
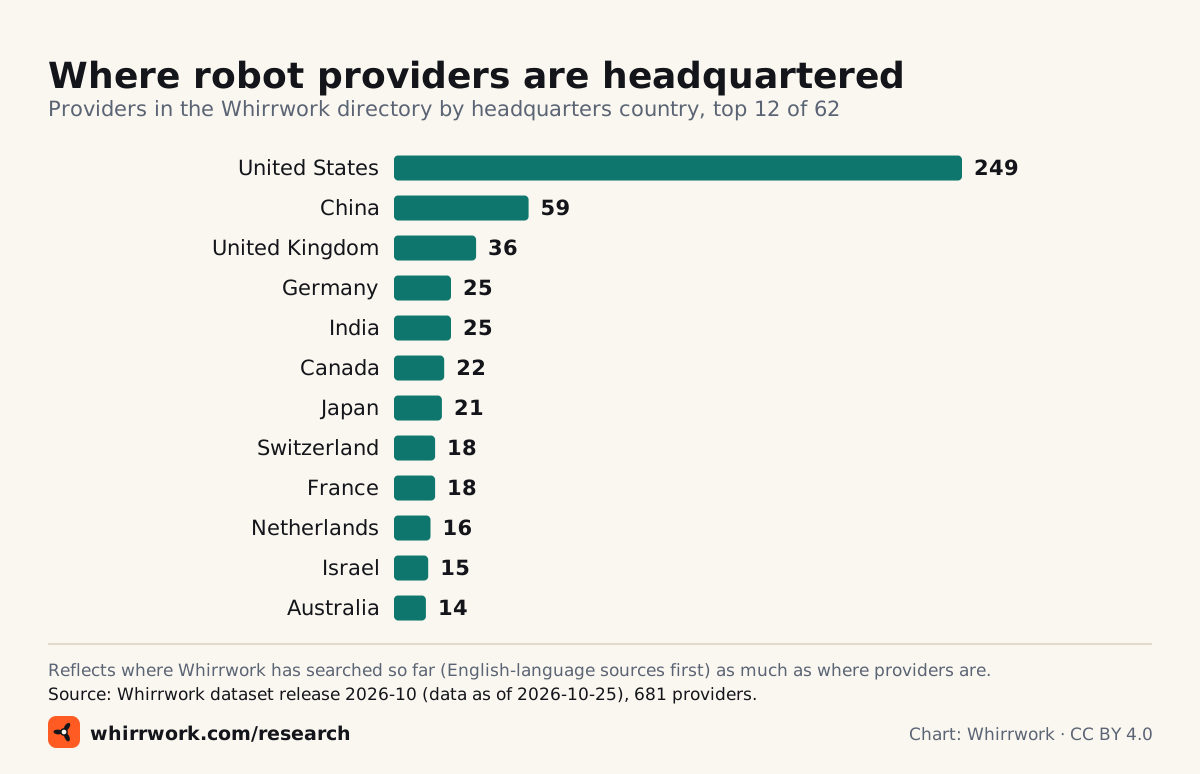
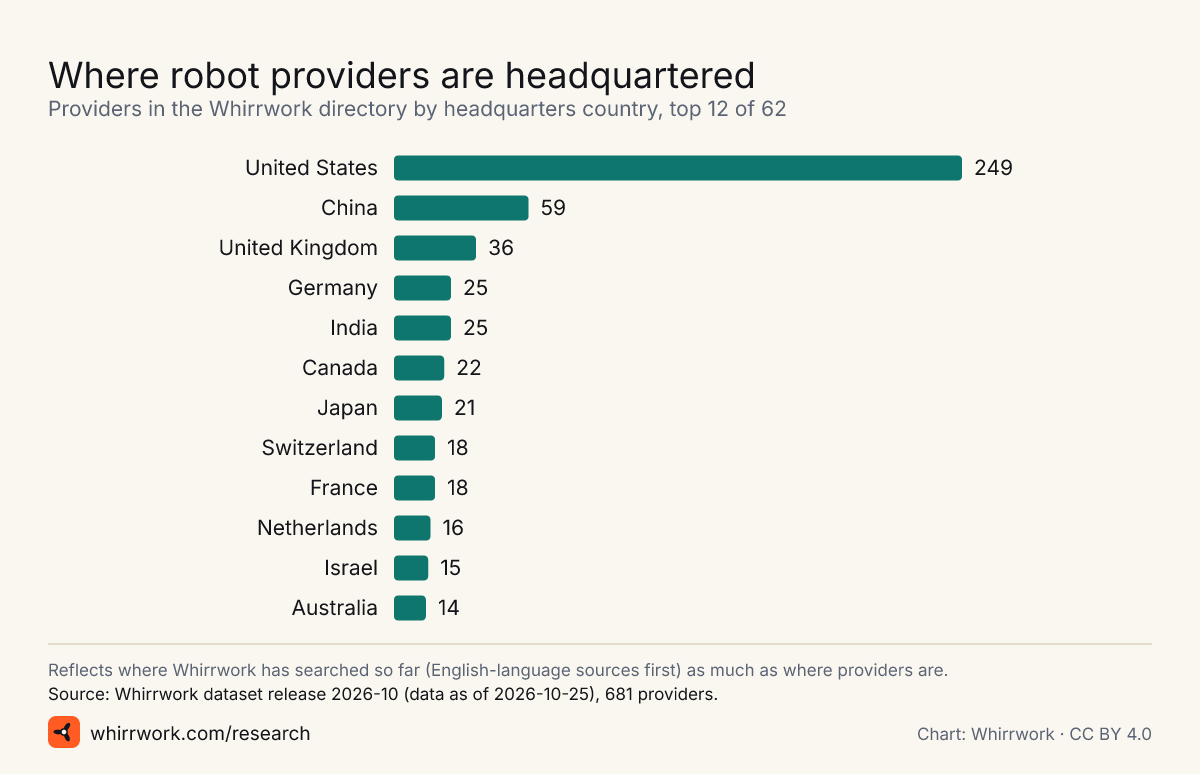
<a href="https://whirrwork.com/press/#chart-whirrwork-providers-by-hq-country"><img src="https://whirrwork.com/research/charts/whirrwork-providers-by-hq-country.svg" width="1200" height="774" alt="Bar chart of providers by headquarters country: United States 249, China 59, United Kingdom 36, Germany 25, India 25, and more."></a>
<p>Chart: <a href="https://whirrwork.com/research/">Whirrwork</a>, CC BY 4.0. Data: Whirrwork dataset release 2026-10 (data as of 2026-10-25), 681 providers.</p>
Iframe (no cookies, no scripts):
<iframe src="https://whirrwork.com/embed/chart/whirrwork-providers-by-hq-country/" width="1200" height="774" style="border:0;width:100%;max-width:720px;height:auto;aspect-ratio:1200/774" loading="lazy" title="Where robot providers are headquartered (Whirrwork chart)"></iframe>
嵌入程式碼
Image:
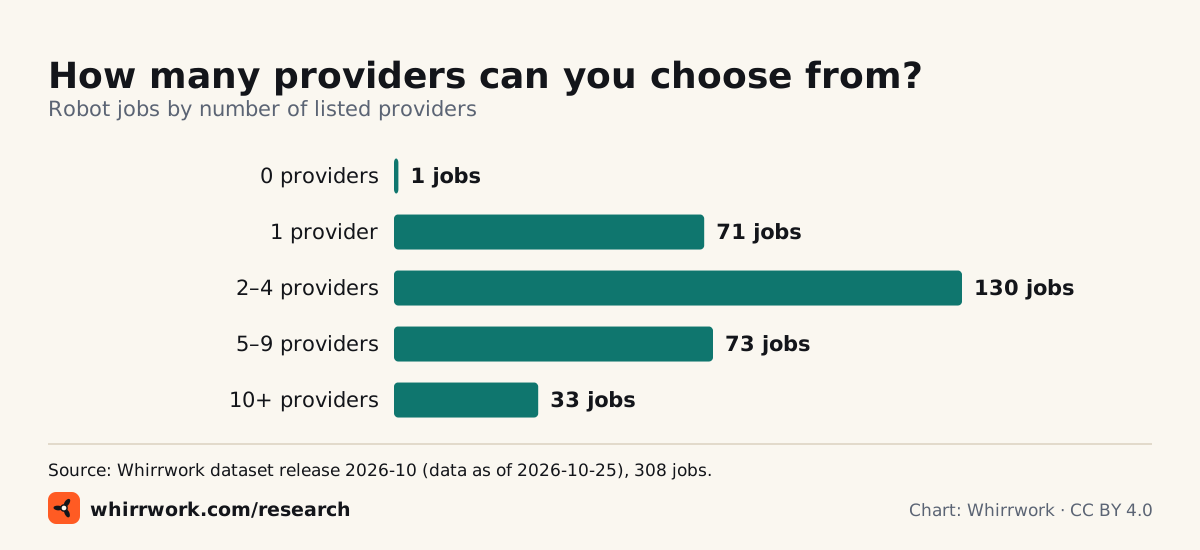
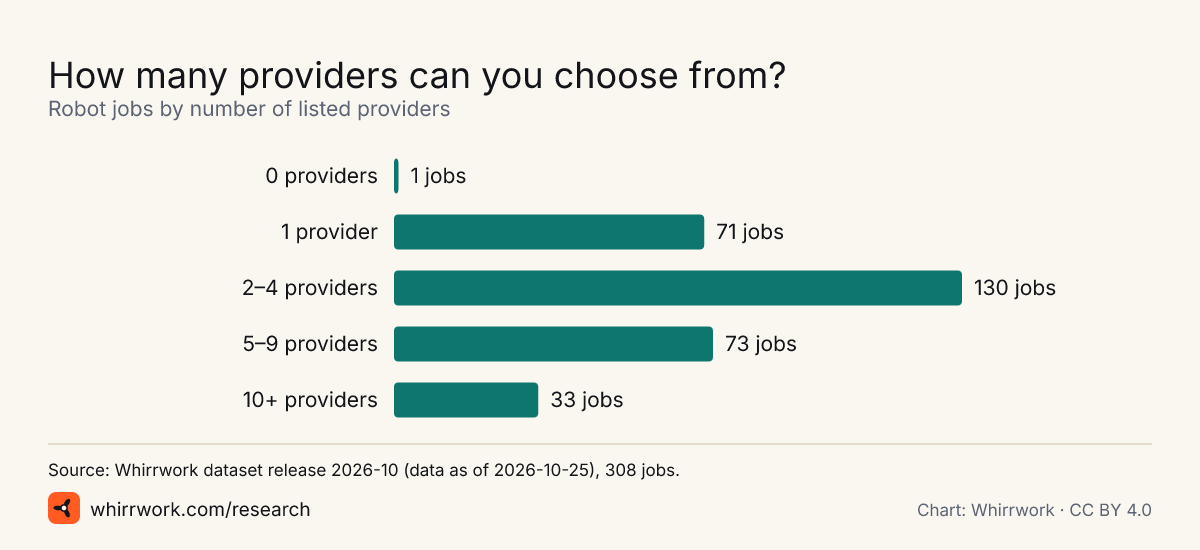
<a href="https://whirrwork.com/press/#chart-whirrwork-jobs-by-provider-count"><img src="https://whirrwork.com/research/charts/whirrwork-jobs-by-provider-count.svg" width="1200" height="550" alt="Bar chart of robot jobs by provider count: 0 providers: 1 jobs; 1 providers: 71 jobs; 2–4 providers: 130 jobs; 5–9 providers: 73 jobs; 10+ providers: 33 jobs."></a>
<p>Chart: <a href="https://whirrwork.com/research/">Whirrwork</a>, CC BY 4.0. Data: Whirrwork dataset release 2026-10 (data as of 2026-10-25), 308 jobs.</p>
Iframe (no cookies, no scripts):
<iframe src="https://whirrwork.com/embed/chart/whirrwork-jobs-by-provider-count/" width="1200" height="550" style="border:0;width:100%;max-width:720px;height:auto;aspect-ratio:1200/550" loading="lazy" title="How many providers can you choose from? (Whirrwork chart)"></iframe>
機器人還是人工?計算器: 比較一項工作由機器人或人工完成的成本,並檢視趨勢和預測。
來自資料的選題建議
America passes Japan on the robot league table
In 2025 the US installed more industrial robots than Japan, which fell to third place behind China and the US, according to the IFR. Which industries drove it, and does reshoring show up in robot orders?
38,428 units (International Federation of Robotics (IFR)) · 36,219 units (International Federation of Robotics (IFR)) · 36,766 (US$2.25bn) robots (Association for Advancing Automation)
China builds and buys most of the world’s robots
China installs more industrial robots than the rest of the top five combined, and Chinese makers now supply over half of its own market.
354,226 units (International Federation of Robotics (IFR)) · 55% percent (International Federation of Robotics (IFR)) · 2,027,200 vs 393,700 units (International Federation of Robotics (IFR))
Crop-spraying drones got cheaper, fast
US farmers paid far less per acre for drone spraying in 2025 while sprayed acreage rose. Who is flying them, and what happened to new drone sales?
$13 USD per acre (American Spray Drone Coalition) · over 16.4 million acres (American Spray Drone Coalition) · ~3,711 units (approx., estimate) (American Spray Drone Coalition)
How many humanoid robots are there, really?
The IFR counts almost 6,900 humanoids sold in 2025; an analyst estimate reported in the press was about twice that. The gap is about definitions, and it matters for every “humanoid boom” headline.
almost 6,900 units (approx.) (International Federation of Robotics (IFR)) · about 13,000 units (approx., analyst estimate) (TechNode) · 1,079 units (HKEXnews (Hong Kong Exchanges and Clearing))
What a humanoid robot costs to buy, rent or subscribe to
List prices now start in the low thousands of dollars, and you can rent one by the day. A price guide with sources.
from $4,900 USD (list price) (Unitree Robotics (online shop)) · from $13,500 USD (list price) (Unitree Robotics) · $20,000 or $499/month USD (1X Technologies) · from US$449/day USD per day (Tempo Robots)
Most robot work still has no price tag
Whirrwork’s dataset shows most robot jobs and most providers publish no price at all. Why the robot-services market still runs on “contact us”.
71% percent of jobs (Whirrwork) · 14% percent of providers (Whirrwork)
Labour shortages, not hype, may be the real robot driver
Record labour-shortage bankruptcies in Japan, hundreds of thousands of unfilled jobs in Korea, and most US contractors with craft workers reporting open craft jobs.
427 bankruptcies (Teikoku Databank (TDB)) · 467,000 (2.4%) workers (e-나라지표 (index.go.kr)) · 88% percent of firms (AGC of America)
Robotics money is back
Robotics start-ups raised more in the first half of 2026 than in all of 2025, according to Crunchbase data. Who is getting it, and who went bust?
$18.8 billion USD (venture funding) (Crunchbase) · $15 billion USD (venture funding) (Crunchbase) · 14 Dec 2025 date (iRobot Corporation)
Korea: the most automated factory workforce on earth
South Korea has 1,220 robots per 10,000 manufacturing workers, far ahead of every other country. What it looks like on the factory floor.
1,220 robots per 10,000 manufacturing employees (International Federation of Robotics (IFR)) · 818 robots per 10,000 manufacturing employees (International Federation of Robotics (IFR)) · 307 robots per 10,000 manufacturing employees (International Federation of Robotics (IFR))
The drone-delivery numbers are getting real
Walmart’s million deliveries, millions of sidewalk-robot deliveries, and robotaxi rides by the hundred thousand a week. Which services are scaling, and where?
more than one million deliveries (cumulative, lower bound) (Walmart Inc.) · 9+ million deliveries (cumulative, lower bound) (Starship Technologies) · 500,000 paid rides per week (TechCrunch)
如何引用 Whirrwork
Source: Whirrwork (https://whirrwork.com), CC BY 4.0
Each statistic and report has APA, Chicago, MLA and BibTeX citations on its own page. For third-party figures, credit the original source too.
許可與署名
文字、統計頁面、圖表和資料集版本均採用知識共享署名 4.0 (CC BY 4.0) 許可。引用的段落仍歸其出版方所有,第三方數字還應註明其原始來源。
署名文字: Source: Whirrwork (https://whirrwork.com), CC BY 4.0 · CC BY 4.0