Whirrwork Research
プレス・メディアキット
私たちについて、データの収集方法、ファクトシート、ロゴ、埋め込み可能なグラフ、データから見える記事のアイデア。
統計の記述、引用、レポート本文は、私たちが検証に使う言語である英語で掲載しています。このページのナビゲーションは自動翻訳です。
私たちについて
Whirrwork は、ロボット作業、ロボットサービス事業者、公開情報に基づく価格をまとめた無料のグローバルディレクトリです。そもそもロボットが必要かどうか、作業にいくらかかるかを判断する手助けをします。
Whirrwork は購入者にとって無料です。購入者の手数料も、有料の順位付けもありません。事業者の掲載も無料です。広告トラッカーは使わず、データも販売しません。
データの収集方法
事業者と価格は公開情報から集めています:企業サイト、公開料金表、公共入札、農業普及サービス、規制当局。すべての価格には、それを記載したページへのリンクと日付があります。外部の統計は公開前に原典と照合し直します。
ファクトシート
Data release 2026-10, as of Oct 25, 2026.
| Robot jobs tracked | 308 |
|---|---|
| Providers listed | 681 |
| Countries covered | 65 |
| Sourced price points | 302 |
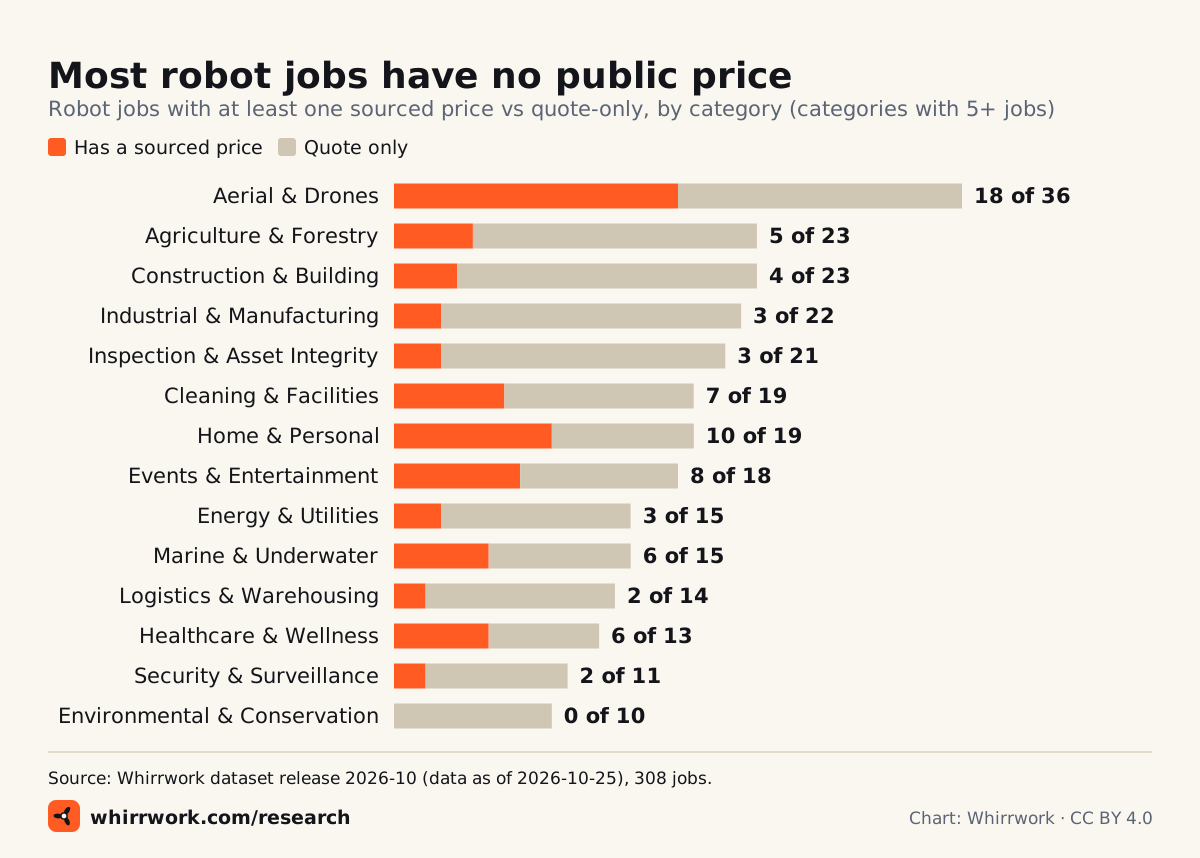
| Jobs with no public price | 71% |
| Citable statistics | 115 |
| Languages | 13 |
| Price for buyers | Free |
報道関係のお問い合わせ
データに関する質問、訂正、取材のご依頼は、お問い合わせフォームをご利用ください。訂正の提案を選び、会社名の欄に媒体名をご記入ください。すべてのメッセージを担当者が読みます。
Press email: press@whirrwork.com
ロゴ
ロゴは明るい背景にも暗い背景にも使えます。周囲には中央の円と同じ大きさの余白を確保してください。最小サイズはシンボルが 20 px、ロゴタイプ付きが 96 px です。シンボルを回転させたり、羽根の色を変えたり、ロボットに顔を描き足したり(気持ちはわかります)、オレンジのシンボルをオレンジの上に置いたりしないでください。




グラフ
すべてのグラフはデータから生成され、画像内に出典が入っています。下のコードで埋め込むか、SVG または PNG でダウンロードしてください。
埋め込みコード
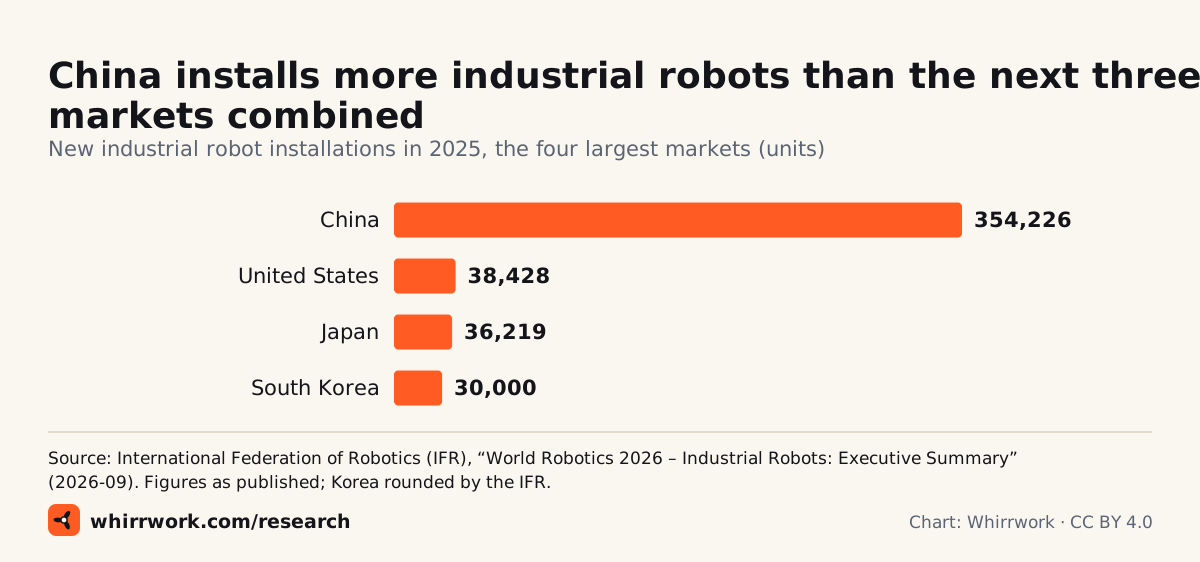
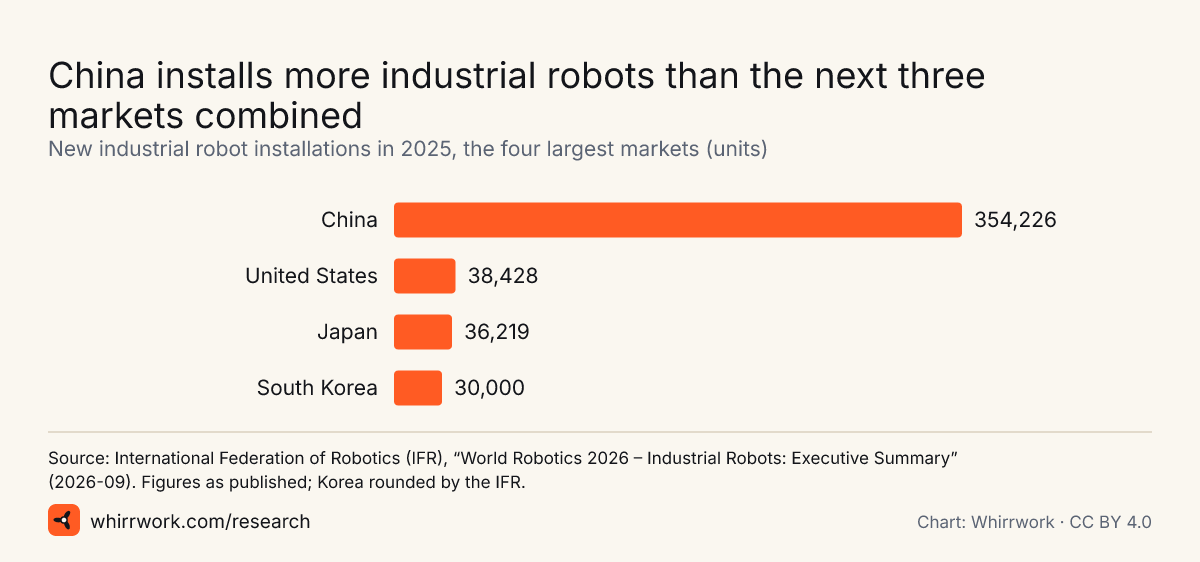
<a href="https://whirrwork.com/press/#chart-ifr-industrial-robot-installations-top-markets-2025"><img src="https://whirrwork.com/research/charts/ifr-industrial-robot-installations-top-markets-2025.svg" width="1200" height="562" alt="Bar chart of 2025 industrial robot installations: China 354,226, United States 38,428, Japan 36,219, Republic of Korea 30,000."></a>
<p>Chart: <a href="https://whirrwork.com/research/">Whirrwork</a>, CC BY 4.0. Data: International Federation of Robotics (IFR), “World Robotics 2026 – Industrial Robots: Executive Summary” (2026-09). Figures as published; Korea rounded by the IFR.</p>
埋め込みコード
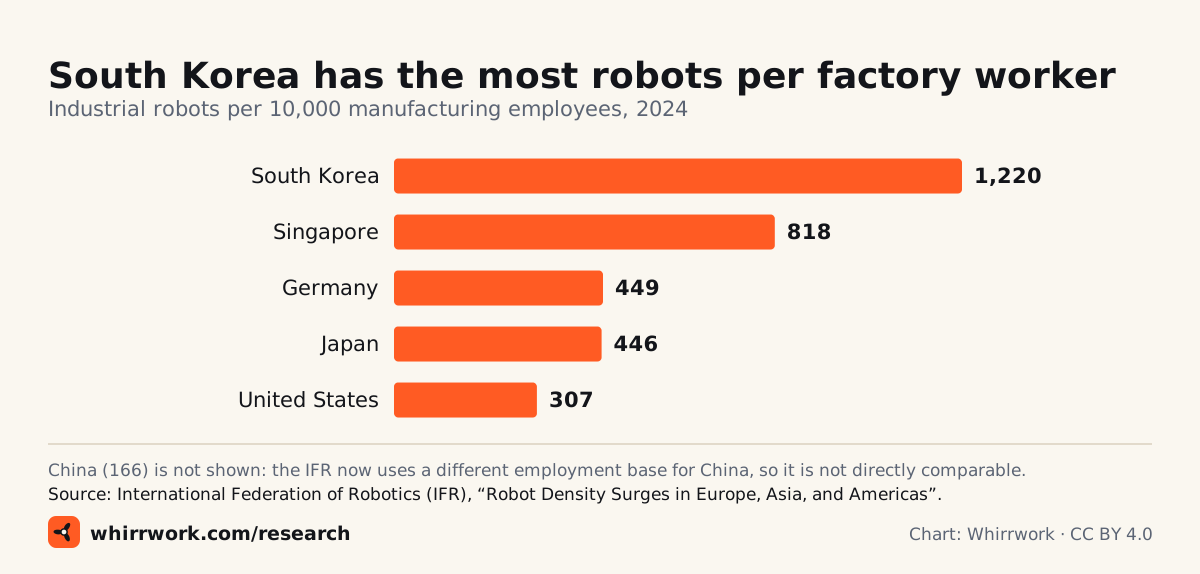
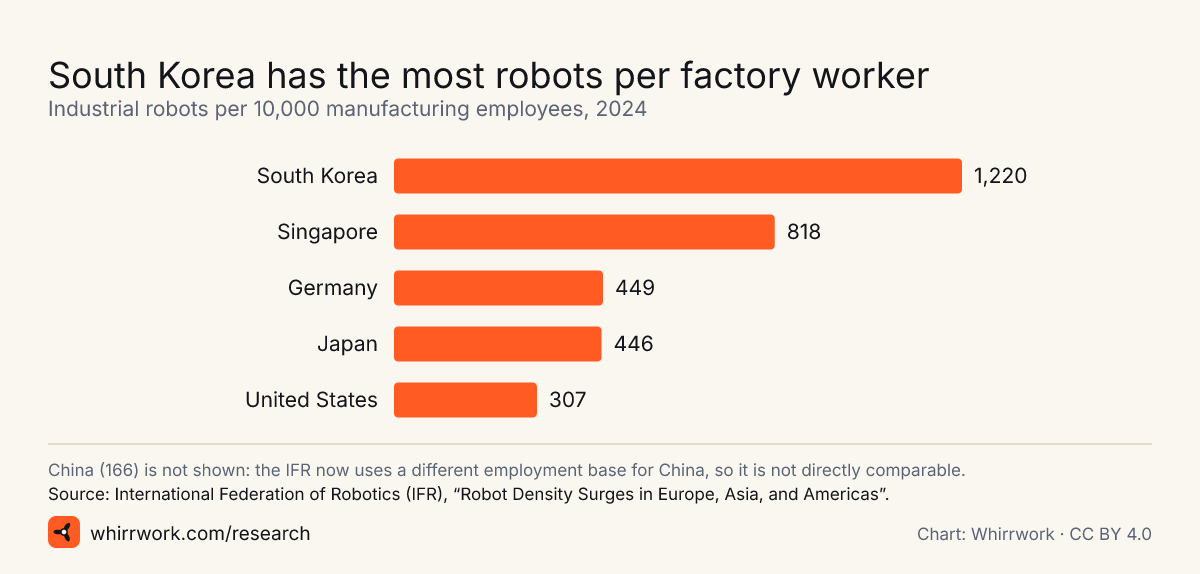
<a href="https://whirrwork.com/press/#chart-ifr-robot-density-2024"><img src="https://whirrwork.com/research/charts/ifr-robot-density-2024.svg" width="1200" height="574" alt="Bar chart of robot density in 2024: Republic of Korea 1,220, Singapore 818, Germany 449, Japan 446, United States 307 robots per 10,000 manufacturing employees."></a>
<p>Chart: <a href="https://whirrwork.com/research/">Whirrwork</a>, CC BY 4.0. Data: International Federation of Robotics (IFR), “Robot Density Surges in Europe, Asia, and Americas”.</p>
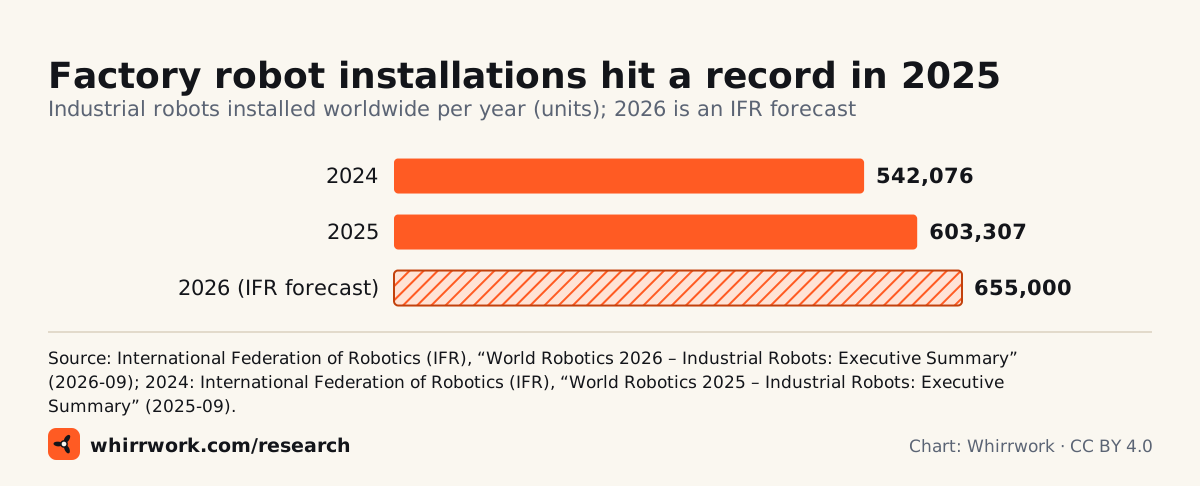
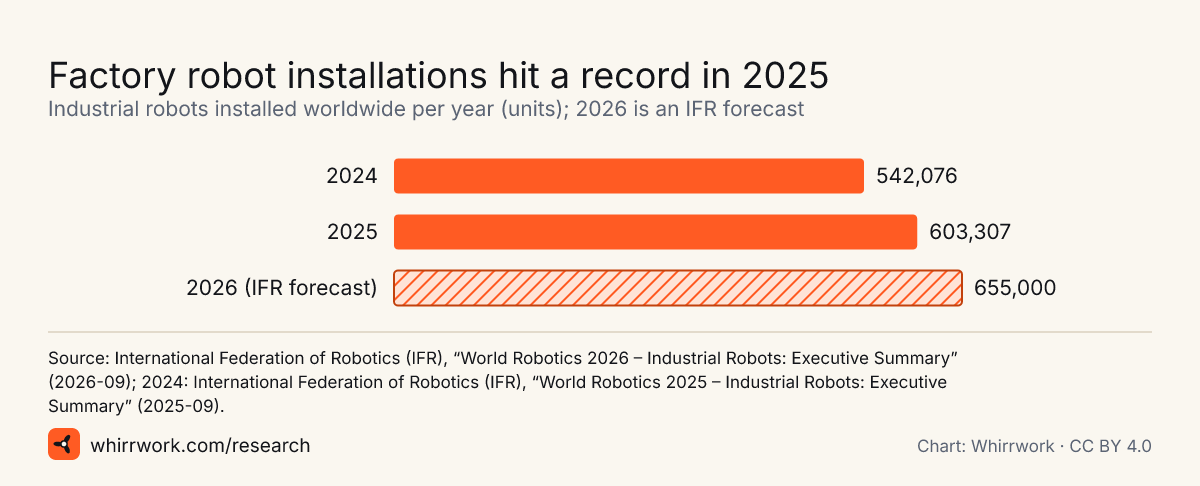
埋め込みコード
<a href="https://whirrwork.com/press/#chart-ifr-world-industrial-robot-installations-2024-2026"><img src="https://whirrwork.com/research/charts/ifr-world-industrial-robot-installations-2024-2026.svg" width="1200" height="486" alt="Bar chart: 542,076 industrial robots installed in 2024, 603,307 in 2025, and an IFR forecast of 655,000 for 2026."></a>
<p>Chart: <a href="https://whirrwork.com/research/">Whirrwork</a>, CC BY 4.0. Data: International Federation of Robotics (IFR), “World Robotics 2026 – Industrial Robots: Executive Summary” (2026-09); 2024: International Federation of Robotics (IFR), “World Robotics 2025 – Industrial Robots: Executive Summary” (2025-09).</p>
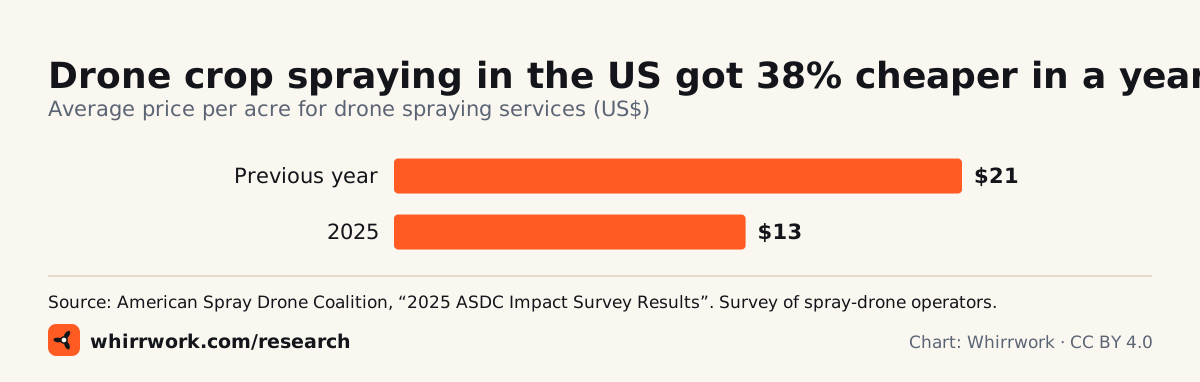
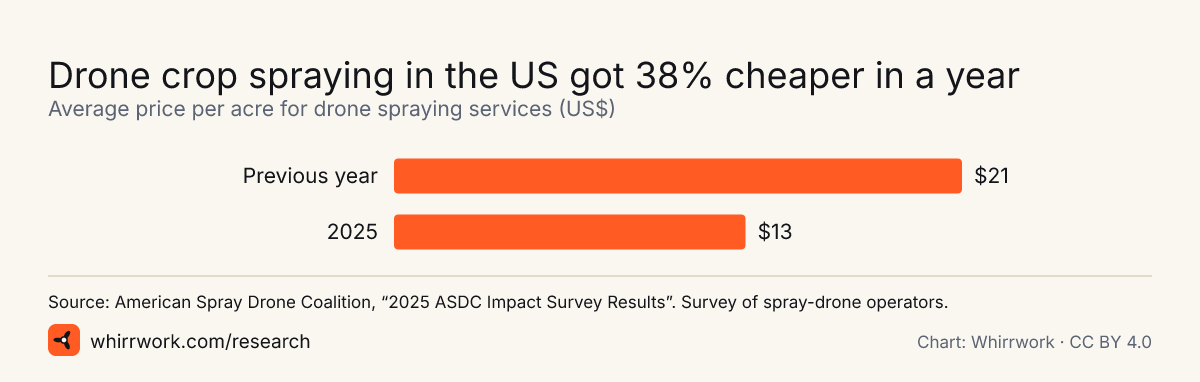
埋め込みコード
<a href="https://whirrwork.com/press/#chart-asdc-us-drone-spraying-price-per-acre"><img src="https://whirrwork.com/research/charts/asdc-us-drone-spraying-price-per-acre.svg" width="1200" height="382" alt="Bar chart: average US drone spraying price per acre, Previous year $21, 2025 $13."></a>
<p>Chart: <a href="https://whirrwork.com/research/">Whirrwork</a>, CC BY 4.0. Data: American Spray Drone Coalition, “2025 ASDC Impact Survey Results”. Survey of spray-drone operators.</p>
埋め込みコード
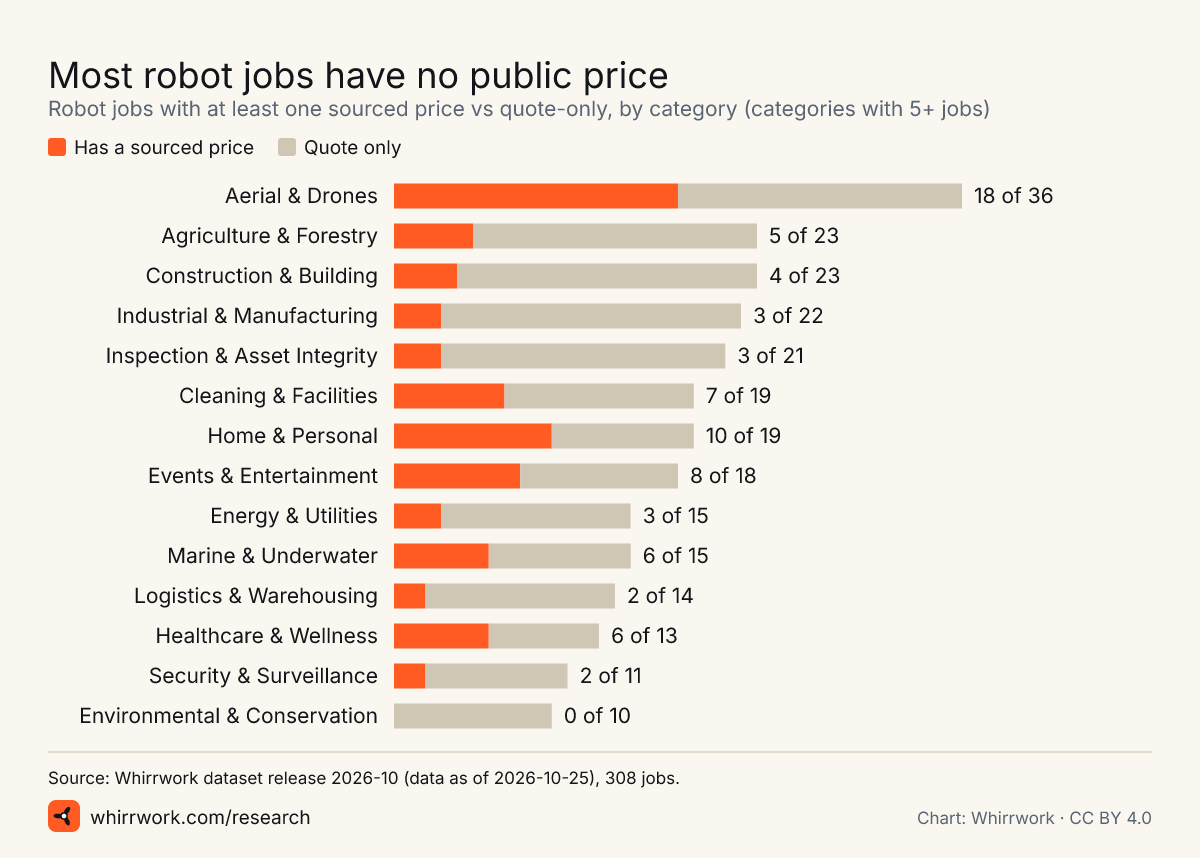
<a href="https://whirrwork.com/press/#chart-whirrwork-priced-jobs-by-category"><img src="https://whirrwork.com/research/charts/whirrwork-priced-jobs-by-category.svg" width="1200" height="858" alt="Stacked bar chart of robot jobs with a public price by category. Overall 88 of 308 jobs have a sourced price."></a>
<p>Chart: <a href="https://whirrwork.com/research/">Whirrwork</a>, CC BY 4.0. Data: Whirrwork dataset release 2026-10 (data as of 2026-10-25), 308 jobs.</p>
埋め込みコード
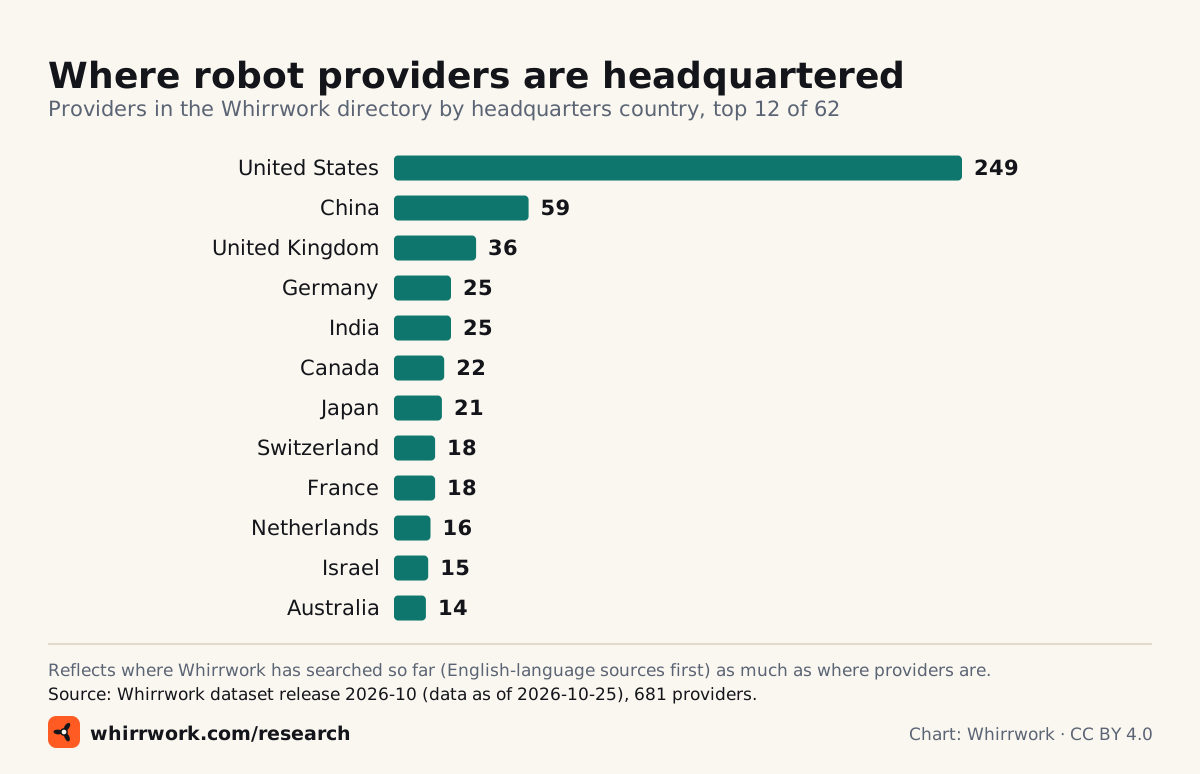
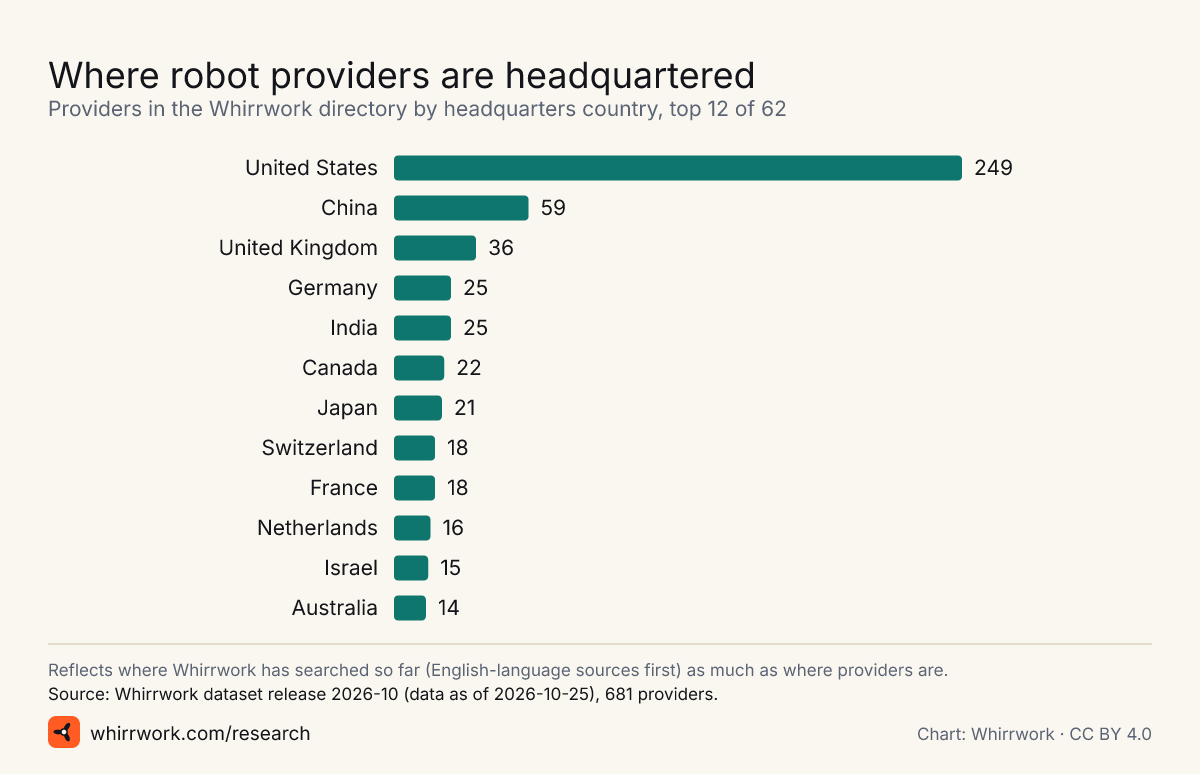
<a href="https://whirrwork.com/press/#chart-whirrwork-providers-by-hq-country"><img src="https://whirrwork.com/research/charts/whirrwork-providers-by-hq-country.svg" width="1200" height="774" alt="Bar chart of providers by headquarters country: United States 249, China 59, United Kingdom 36, Germany 25, India 25, and more."></a>
<p>Chart: <a href="https://whirrwork.com/research/">Whirrwork</a>, CC BY 4.0. Data: Whirrwork dataset release 2026-10 (data as of 2026-10-25), 681 providers.</p>
埋め込みコード
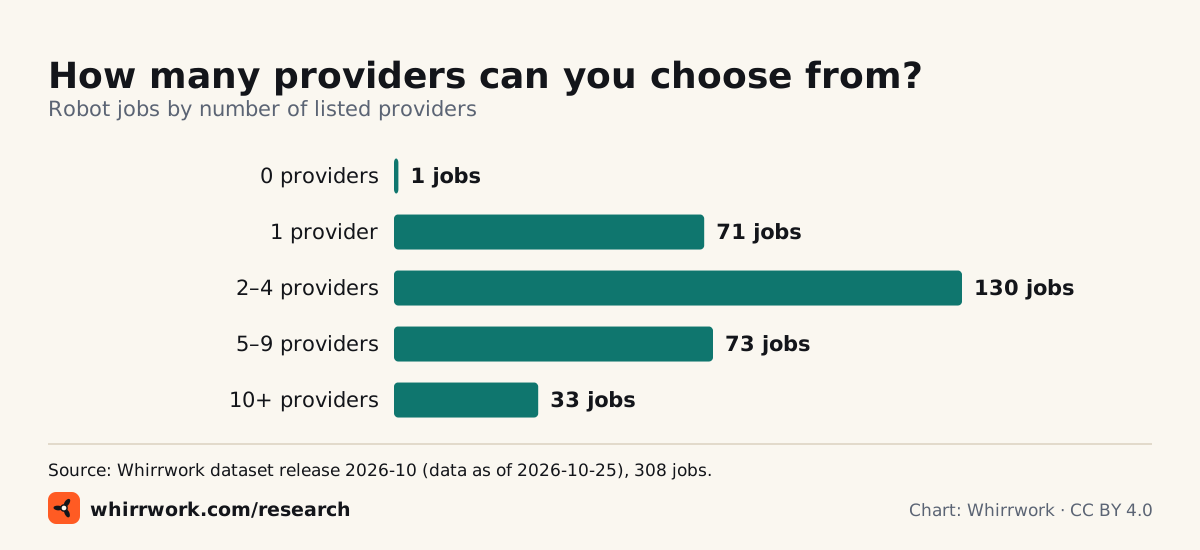
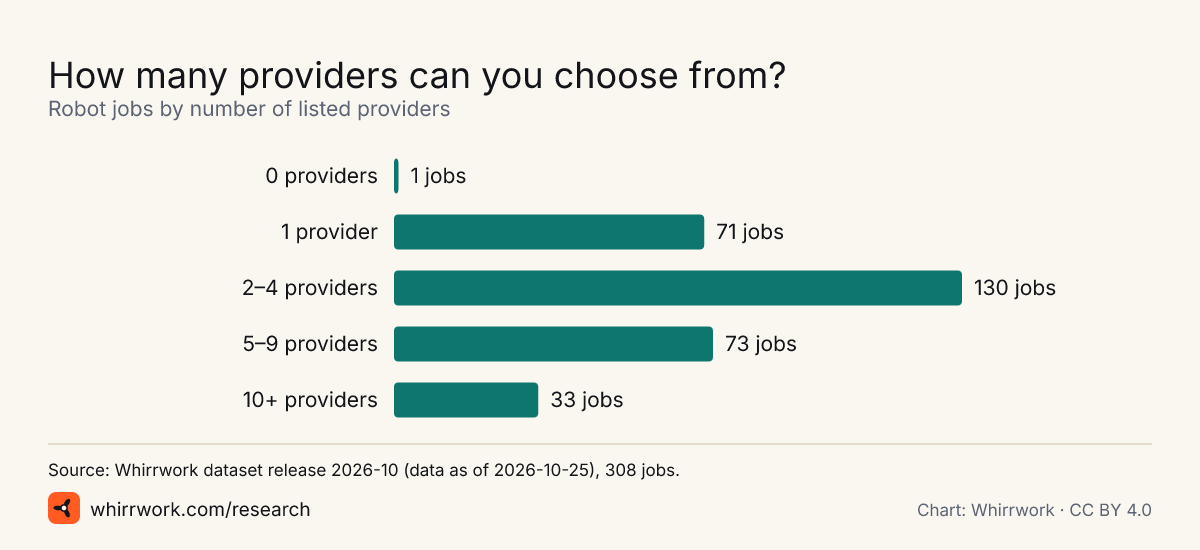
<a href="https://whirrwork.com/press/#chart-whirrwork-jobs-by-provider-count"><img src="https://whirrwork.com/research/charts/whirrwork-jobs-by-provider-count.svg" width="1200" height="550" alt="Bar chart of robot jobs by provider count: 0 providers: 1 jobs; 1 providers: 71 jobs; 2–4 providers: 130 jobs; 5–9 providers: 73 jobs; 10+ providers: 33 jobs."></a>
<p>Chart: <a href="https://whirrwork.com/research/">Whirrwork</a>, CC BY 4.0. Data: Whirrwork dataset release 2026-10 (data as of 2026-10-25), 308 jobs.</p>
ロボットか人か?計算ツール: 作業をロボットで行う場合と人が行う場合のコストを、傾向と予測とともに比較できます。
データから見える記事のアイデア
America passes Japan on the robot league table
In 2025 the US installed more industrial robots than Japan, which fell to third place behind China and the US, according to the IFR. Which industries drove it, and does reshoring show up in robot orders?
38,428 units (International Federation of Robotics (IFR)) · 36,219 units (International Federation of Robotics (IFR)) · 36,766 (US$2.25bn) robots (Association for Advancing Automation)
China builds and buys most of the world’s robots
China installs more industrial robots than the rest of the top five combined, and Chinese makers now supply over half of its own market.
354,226 units (International Federation of Robotics (IFR)) · 55% percent (International Federation of Robotics (IFR)) · 2,027,200 vs 393,700 units (International Federation of Robotics (IFR))
Crop-spraying drones got cheaper, fast
US farmers paid far less per acre for drone spraying in 2025 while sprayed acreage rose. Who is flying them, and what happened to new drone sales?
$13 USD per acre (American Spray Drone Coalition) · over 16.4 million acres (American Spray Drone Coalition) · ~3,711 units (approx., estimate) (American Spray Drone Coalition)
How many humanoid robots are there, really?
The IFR counts almost 6,900 humanoids sold in 2025; an analyst estimate reported in the press was about twice that. The gap is about definitions, and it matters for every “humanoid boom” headline.
almost 6,900 units (approx.) (International Federation of Robotics (IFR)) · about 13,000 units (approx., analyst estimate) (TechNode) · 1,079 units (HKEXnews (Hong Kong Exchanges and Clearing))
What a humanoid robot costs to buy, rent or subscribe to
List prices now start in the low thousands of dollars, and you can rent one by the day. A price guide with sources.
from $4,900 USD (list price) (Unitree Robotics (online shop)) · from $13,500 USD (list price) (Unitree Robotics) · $20,000 or $499/month USD (1X Technologies) · from US$449/day USD per day (Tempo Robots)
Most robot work still has no price tag
Whirrwork’s dataset shows most robot jobs and most providers publish no price at all. Why the robot-services market still runs on “contact us”.
71% percent of jobs (Whirrwork) · 14% percent of providers (Whirrwork)
Labour shortages, not hype, may be the real robot driver
Record labour-shortage bankruptcies in Japan, hundreds of thousands of unfilled jobs in Korea, and most US contractors with craft workers reporting open craft jobs.
427 bankruptcies (Teikoku Databank (TDB)) · 467,000 (2.4%) workers (e-나라지표 (index.go.kr)) · 88% percent of firms (AGC of America)
Robotics money is back
Robotics start-ups raised more in the first half of 2026 than in all of 2025, according to Crunchbase data. Who is getting it, and who went bust?
$18.8 billion USD (venture funding) (Crunchbase) · $15 billion USD (venture funding) (Crunchbase) · 14 Dec 2025 date (iRobot Corporation)
Korea: the most automated factory workforce on earth
South Korea has 1,220 robots per 10,000 manufacturing workers, far ahead of every other country. What it looks like on the factory floor.
1,220 robots per 10,000 manufacturing employees (International Federation of Robotics (IFR)) · 818 robots per 10,000 manufacturing employees (International Federation of Robotics (IFR)) · 307 robots per 10,000 manufacturing employees (International Federation of Robotics (IFR))
The drone-delivery numbers are getting real
Walmart’s million deliveries, millions of sidewalk-robot deliveries, and robotaxi rides by the hundred thousand a week. Which services are scaling, and where?
more than one million deliveries (cumulative, lower bound) (Walmart Inc.) · 9+ million deliveries (cumulative, lower bound) (Starship Technologies) · 500,000 paid rides per week (TechCrunch)
Whirrwork の引用方法
Source: Whirrwork (https://whirrwork.com), CC BY 4.0
Each statistic and report has APA, Chicago, MLA and BibTeX citations on its own page. For third-party figures, credit the original source too.
ライセンスとクレジット表記
文章、統計ページ、グラフ、データセットのリリースは、クリエイティブ・コモンズ 表示 4.0(CC BY 4.0)でライセンスされています。引用した文章の権利は各発行者に帰属し、第三者の数値は原典にもクレジットしてください。
クレジット表記の文言: Source: Whirrwork (https://whirrwork.com), CC BY 4.0 · CC BY 4.0