Whirrwork Research
Press and media kit
Who we are, how the data is gathered, a fact sheet, logos, charts you can embed, and story ideas from the data.
Who we are
Whirrwork is a free global directory of robot jobs, robot service providers and publicly sourced prices. It helps people decide whether they need a robot at all, and what the work costs.
Whirrwork is free for buyers: no buyer fees and no pay-to-rank. Suppliers are listed for free. We run no ad trackers and we don't sell data.
How the data is gathered
Providers and prices are compiled from public sources: company websites, published rate cards, public tenders, extension services and regulators. Every price links to the page that states it, with a date. External statistics are re-checked against their sources before publication.
Fact sheet
Data release 2026-10, as of Oct 25, 2026.
| Robot jobs tracked | 308 |
|---|---|
| Providers listed | 681 |
| Countries covered | 65 |
| Sourced price points | 302 |
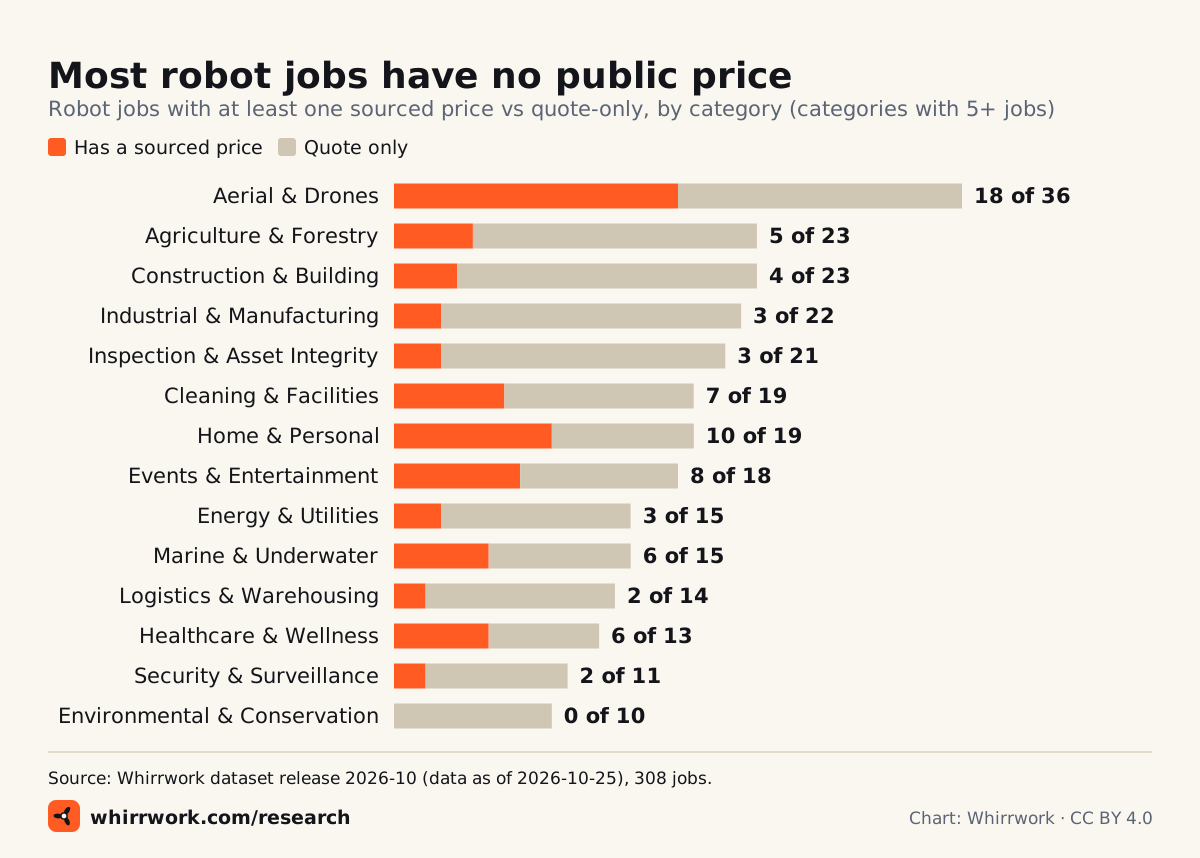
| Jobs with no public price | 71% |
| Citable statistics | 115 |
| Languages | 13 |
| Price for buyers | Free |
Press contact
For data questions, corrections or interviews, email us or use our contact form: choose "Suggest a correction" and put your publication in the company field. A person reads every message.
Press email: press@whirrwork.com
Logos
The logo works on light or dark backgrounds. Keep clear space equal to the hub circle on all sides; minimum size is 20 px for the mark and 96 px for the lockup. Please don't rotate the mark, recolour the blades, add a face to the robot (tempting, we know), or put the orange mark on orange.




Charts
Every chart is generated from the data and carries its source line inside the image. Embed it with the code below or download SVG or PNG.
Embed code
Image:
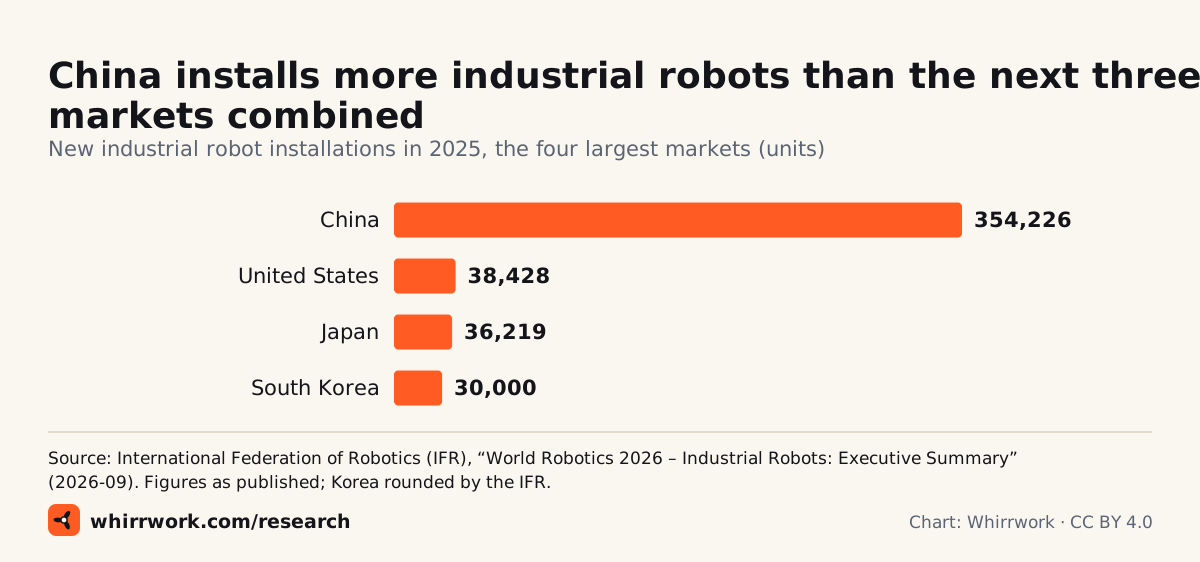
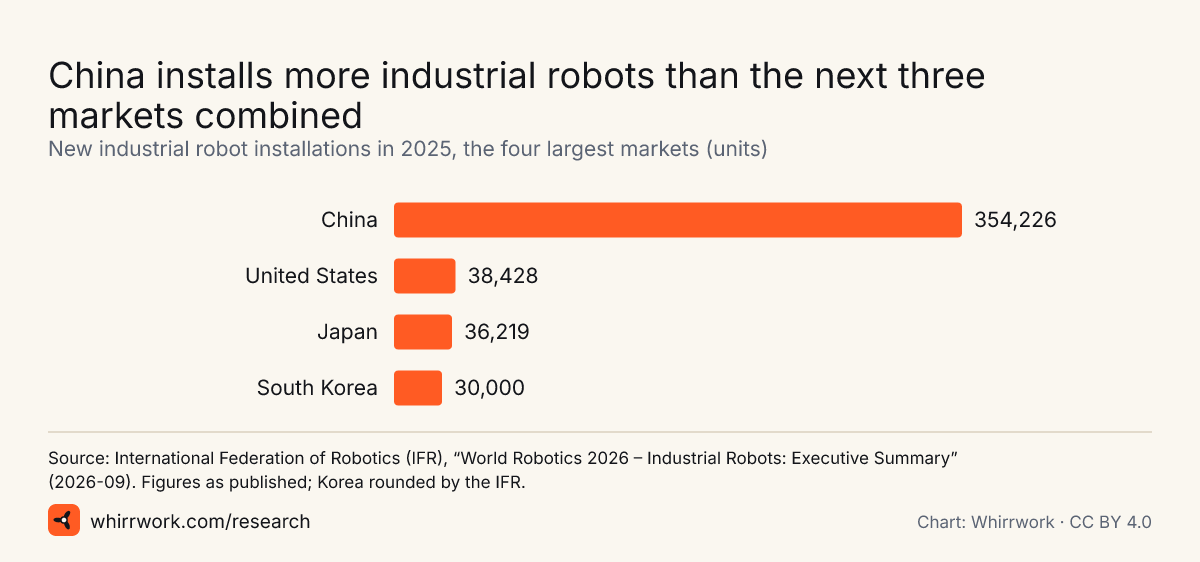
<a href="https://whirrwork.com/press/#chart-ifr-industrial-robot-installations-top-markets-2025"><img src="https://whirrwork.com/research/charts/ifr-industrial-robot-installations-top-markets-2025.svg" width="1200" height="562" alt="Bar chart of 2025 industrial robot installations: China 354,226, United States 38,428, Japan 36,219, Republic of Korea 30,000."></a>
<p>Chart: <a href="https://whirrwork.com/research/">Whirrwork</a>, CC BY 4.0. Data: International Federation of Robotics (IFR), “World Robotics 2026 – Industrial Robots: Executive Summary” (2026-09). Figures as published; Korea rounded by the IFR.</p>
Iframe (no cookies, no scripts):
<iframe src="https://whirrwork.com/embed/chart/ifr-industrial-robot-installations-top-markets-2025/" width="1200" height="562" style="border:0;width:100%;max-width:720px;height:auto;aspect-ratio:1200/562" loading="lazy" title="China installs more industrial robots than the next three markets combined (Whirrwork chart)"></iframe>
Embed code
Image:
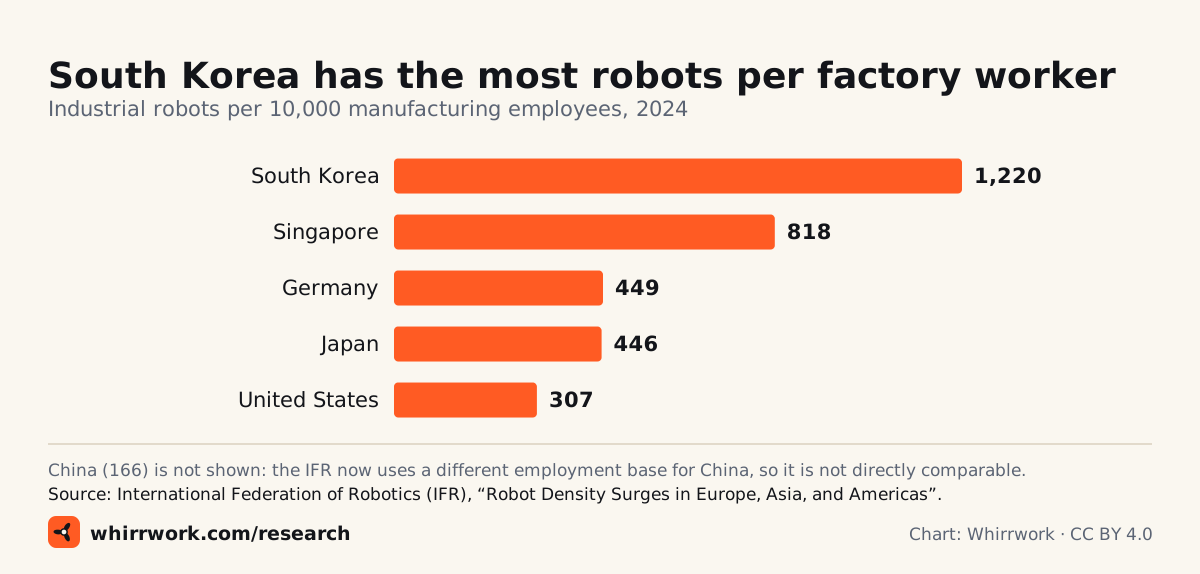
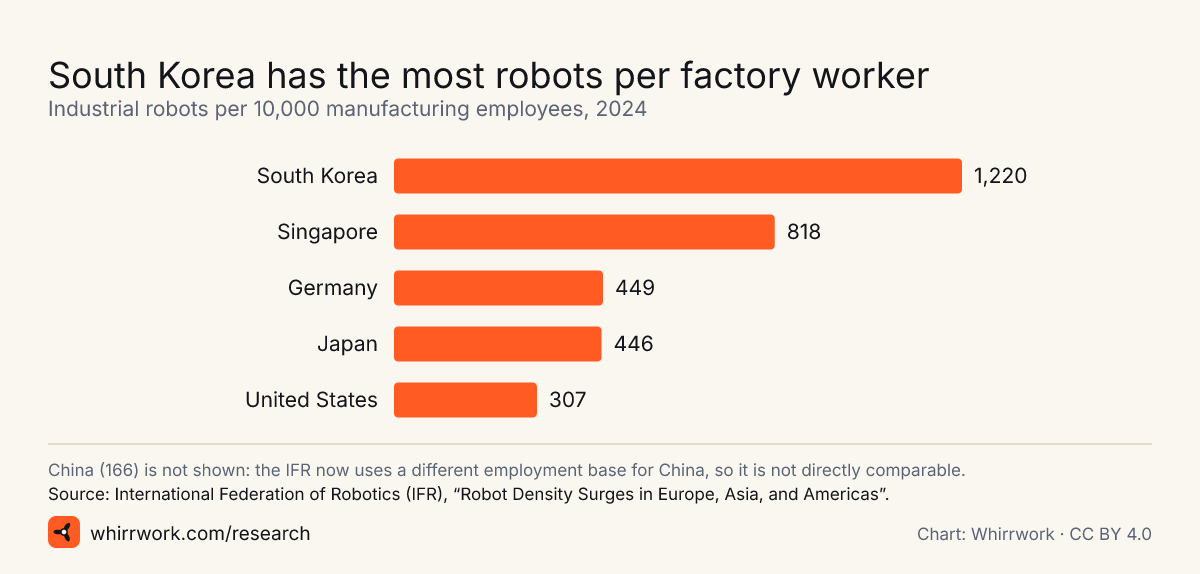
<a href="https://whirrwork.com/press/#chart-ifr-robot-density-2024"><img src="https://whirrwork.com/research/charts/ifr-robot-density-2024.svg" width="1200" height="574" alt="Bar chart of robot density in 2024: Republic of Korea 1,220, Singapore 818, Germany 449, Japan 446, United States 307 robots per 10,000 manufacturing employees."></a>
<p>Chart: <a href="https://whirrwork.com/research/">Whirrwork</a>, CC BY 4.0. Data: International Federation of Robotics (IFR), “Robot Density Surges in Europe, Asia, and Americas”.</p>
Iframe (no cookies, no scripts):
<iframe src="https://whirrwork.com/embed/chart/ifr-robot-density-2024/" width="1200" height="574" style="border:0;width:100%;max-width:720px;height:auto;aspect-ratio:1200/574" loading="lazy" title="South Korea has the most robots per factory worker (Whirrwork chart)"></iframe>
Embed code
Image:
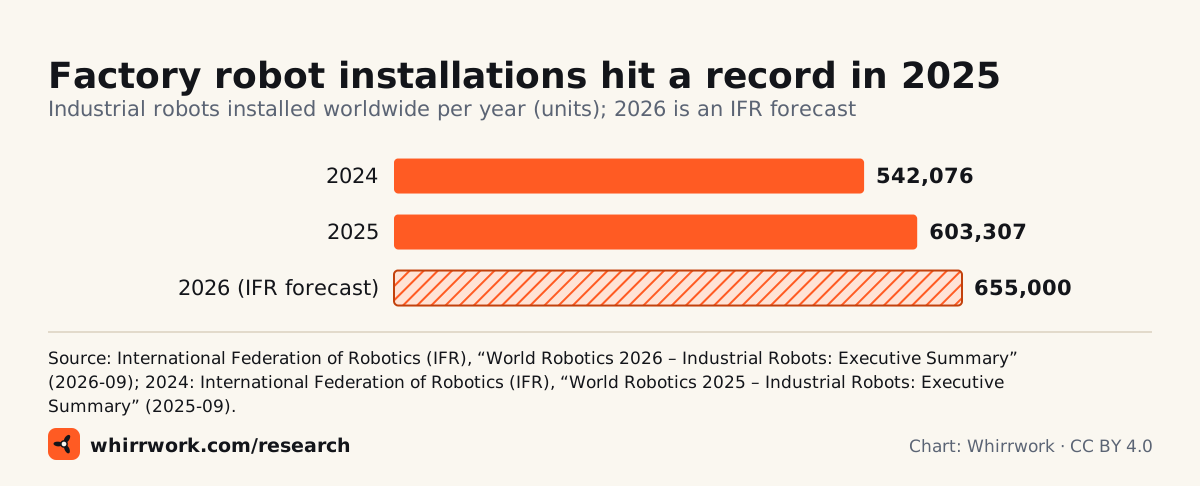
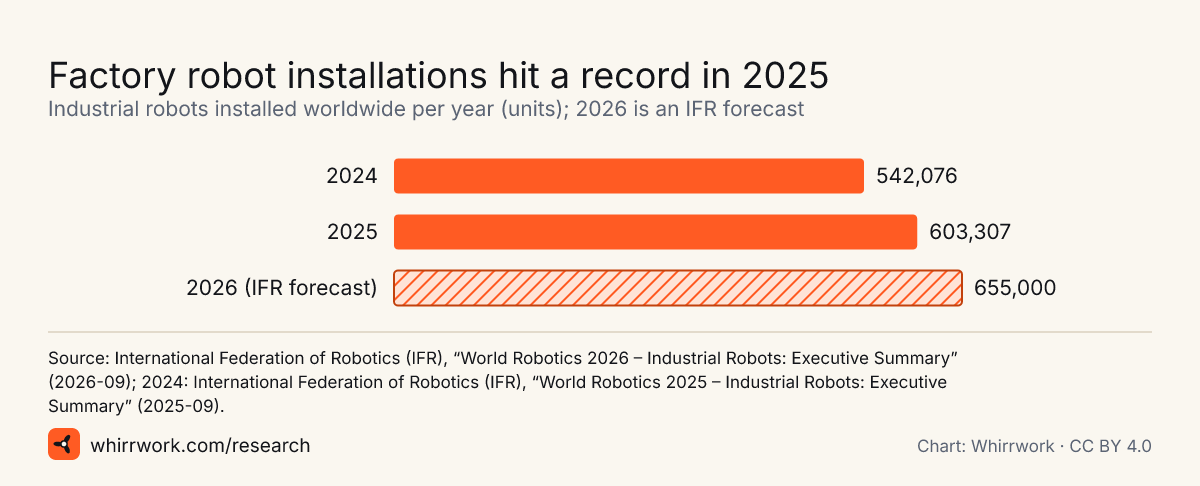
<a href="https://whirrwork.com/press/#chart-ifr-world-industrial-robot-installations-2024-2026"><img src="https://whirrwork.com/research/charts/ifr-world-industrial-robot-installations-2024-2026.svg" width="1200" height="486" alt="Bar chart: 542,076 industrial robots installed in 2024, 603,307 in 2025, and an IFR forecast of 655,000 for 2026."></a>
<p>Chart: <a href="https://whirrwork.com/research/">Whirrwork</a>, CC BY 4.0. Data: International Federation of Robotics (IFR), “World Robotics 2026 – Industrial Robots: Executive Summary” (2026-09); 2024: International Federation of Robotics (IFR), “World Robotics 2025 – Industrial Robots: Executive Summary” (2025-09).</p>
Iframe (no cookies, no scripts):
<iframe src="https://whirrwork.com/embed/chart/ifr-world-industrial-robot-installations-2024-2026/" width="1200" height="486" style="border:0;width:100%;max-width:720px;height:auto;aspect-ratio:1200/486" loading="lazy" title="Factory robot installations hit a record in 2025 (Whirrwork chart)"></iframe>
Embed code
Image:
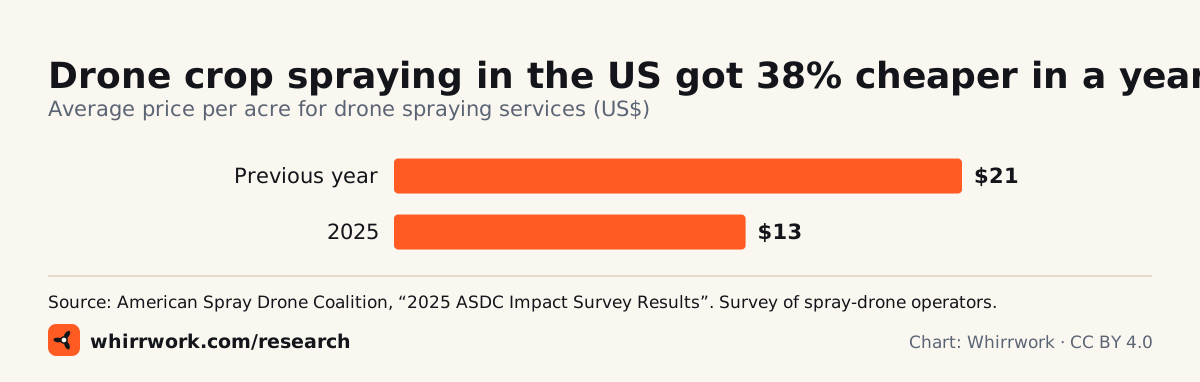
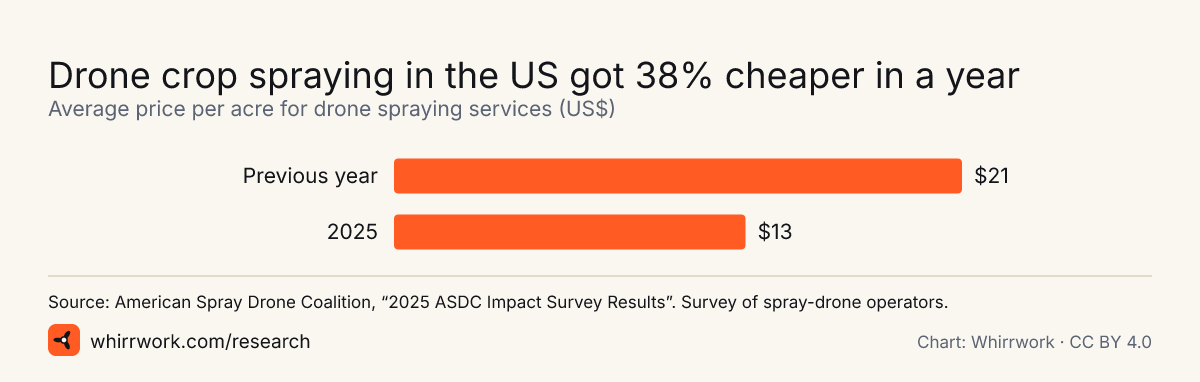
<a href="https://whirrwork.com/press/#chart-asdc-us-drone-spraying-price-per-acre"><img src="https://whirrwork.com/research/charts/asdc-us-drone-spraying-price-per-acre.svg" width="1200" height="382" alt="Bar chart: average US drone spraying price per acre, Previous year $21, 2025 $13."></a>
<p>Chart: <a href="https://whirrwork.com/research/">Whirrwork</a>, CC BY 4.0. Data: American Spray Drone Coalition, “2025 ASDC Impact Survey Results”. Survey of spray-drone operators.</p>
Iframe (no cookies, no scripts):
<iframe src="https://whirrwork.com/embed/chart/asdc-us-drone-spraying-price-per-acre/" width="1200" height="382" style="border:0;width:100%;max-width:720px;height:auto;aspect-ratio:1200/382" loading="lazy" title="Drone crop spraying in the US got 38% cheaper in a year (Whirrwork chart)"></iframe>
Embed code
Image:
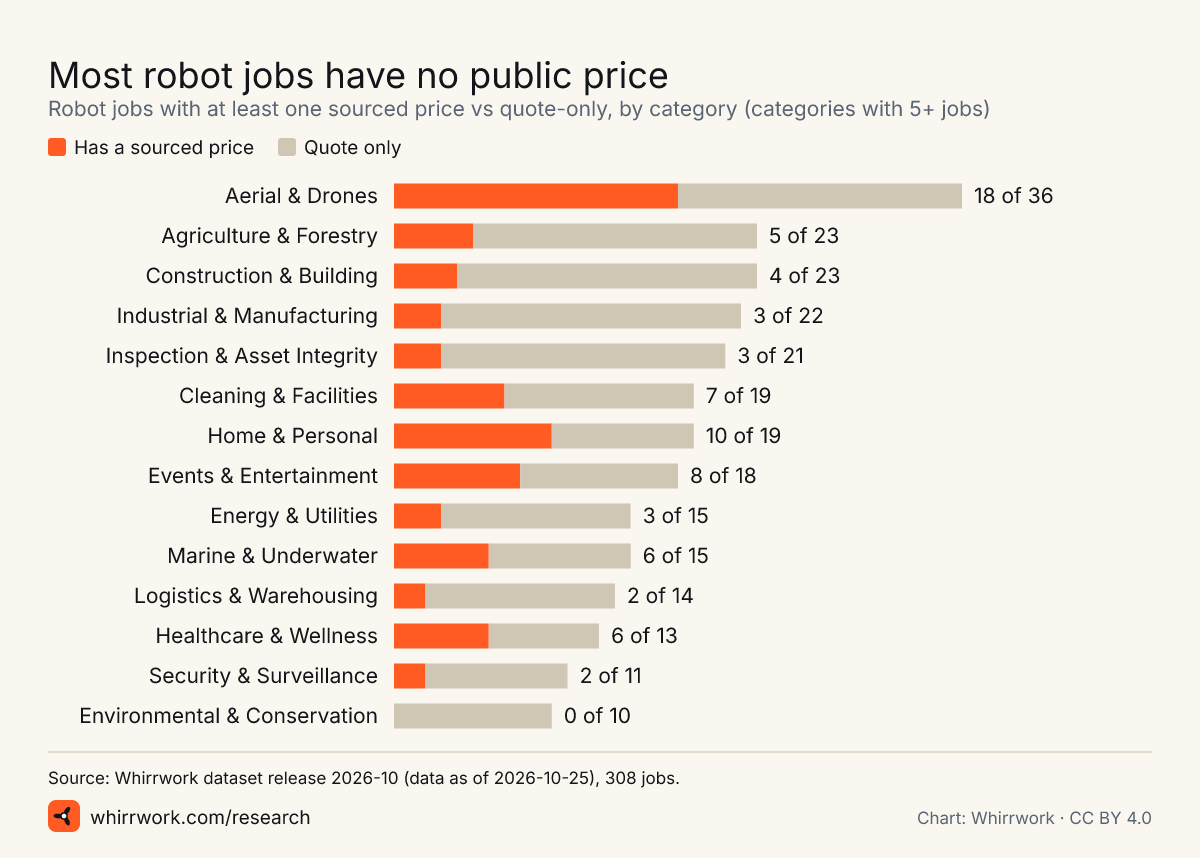
<a href="https://whirrwork.com/press/#chart-whirrwork-priced-jobs-by-category"><img src="https://whirrwork.com/research/charts/whirrwork-priced-jobs-by-category.svg" width="1200" height="858" alt="Stacked bar chart of robot jobs with a public price by category. Overall 88 of 308 jobs have a sourced price."></a>
<p>Chart: <a href="https://whirrwork.com/research/">Whirrwork</a>, CC BY 4.0. Data: Whirrwork dataset release 2026-10 (data as of 2026-10-25), 308 jobs.</p>
Iframe (no cookies, no scripts):
<iframe src="https://whirrwork.com/embed/chart/whirrwork-priced-jobs-by-category/" width="1200" height="858" style="border:0;width:100%;max-width:720px;height:auto;aspect-ratio:1200/858" loading="lazy" title="Most robot jobs have no public price (Whirrwork chart)"></iframe>
Embed code
Image:
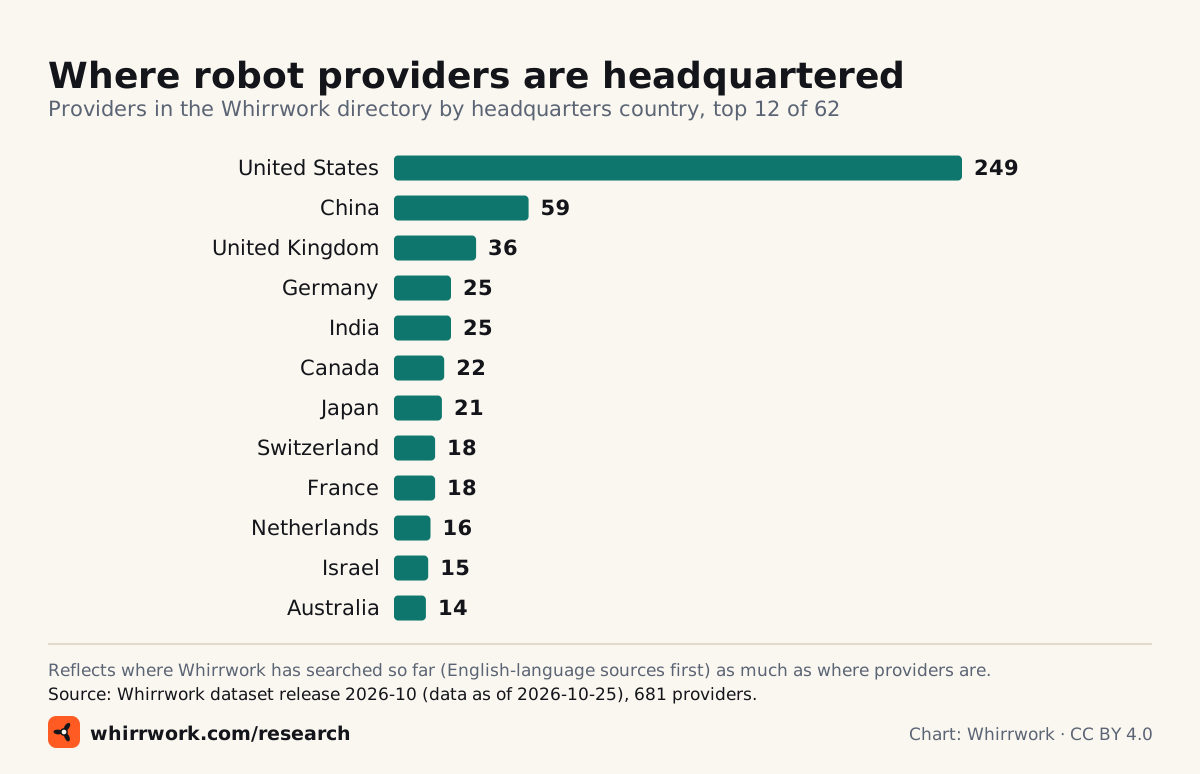
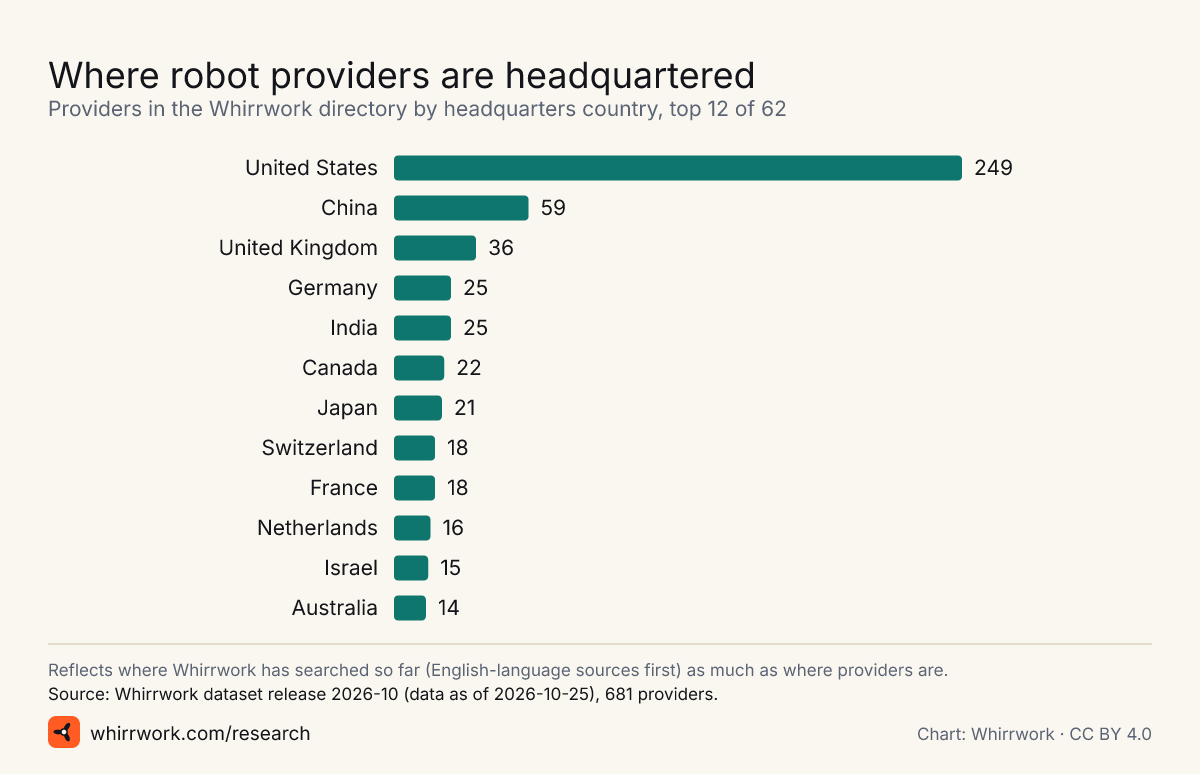
<a href="https://whirrwork.com/press/#chart-whirrwork-providers-by-hq-country"><img src="https://whirrwork.com/research/charts/whirrwork-providers-by-hq-country.svg" width="1200" height="774" alt="Bar chart of providers by headquarters country: United States 249, China 59, United Kingdom 36, Germany 25, India 25, and more."></a>
<p>Chart: <a href="https://whirrwork.com/research/">Whirrwork</a>, CC BY 4.0. Data: Whirrwork dataset release 2026-10 (data as of 2026-10-25), 681 providers.</p>
Iframe (no cookies, no scripts):
<iframe src="https://whirrwork.com/embed/chart/whirrwork-providers-by-hq-country/" width="1200" height="774" style="border:0;width:100%;max-width:720px;height:auto;aspect-ratio:1200/774" loading="lazy" title="Where robot providers are headquartered (Whirrwork chart)"></iframe>
Embed code
Image:
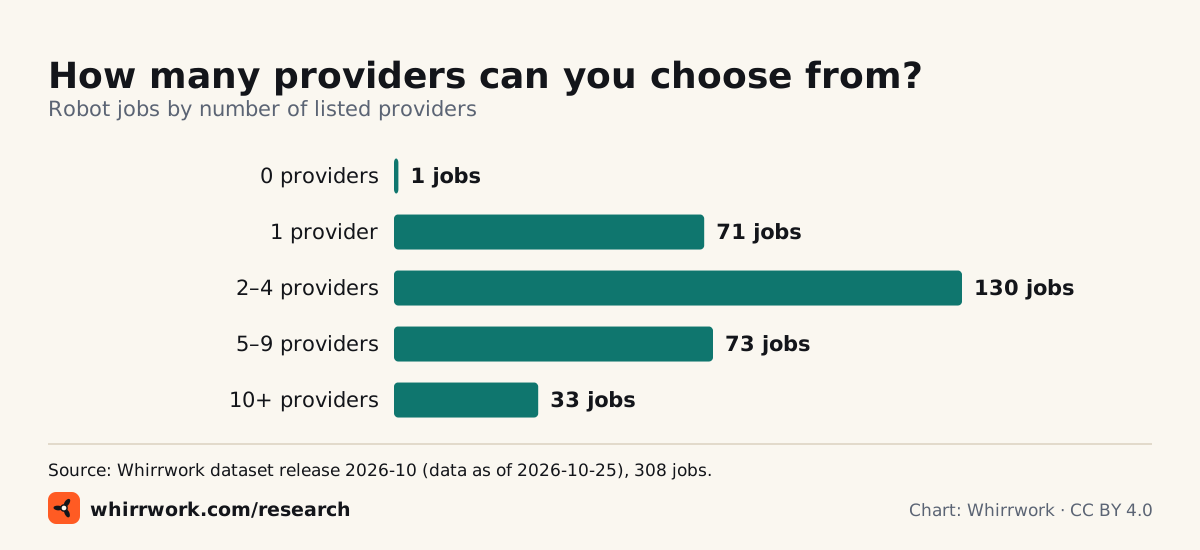
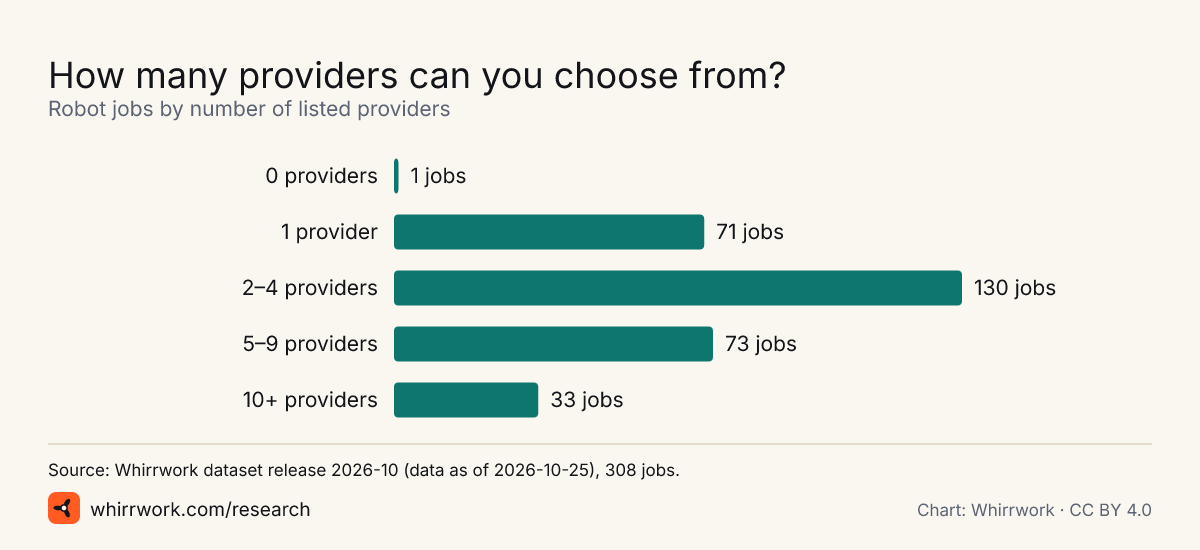
<a href="https://whirrwork.com/press/#chart-whirrwork-jobs-by-provider-count"><img src="https://whirrwork.com/research/charts/whirrwork-jobs-by-provider-count.svg" width="1200" height="550" alt="Bar chart of robot jobs by provider count: 0 providers: 1 jobs; 1 providers: 71 jobs; 2–4 providers: 130 jobs; 5–9 providers: 73 jobs; 10+ providers: 33 jobs."></a>
<p>Chart: <a href="https://whirrwork.com/research/">Whirrwork</a>, CC BY 4.0. Data: Whirrwork dataset release 2026-10 (data as of 2026-10-25), 308 jobs.</p>
Iframe (no cookies, no scripts):
<iframe src="https://whirrwork.com/embed/chart/whirrwork-jobs-by-provider-count/" width="1200" height="550" style="border:0;width:100%;max-width:720px;height:auto;aspect-ratio:1200/550" loading="lazy" title="How many providers can you choose from? (Whirrwork chart)"></iframe>
Robot or human? calculator: Compare what a job costs done by a robot or by people, with trendlines and projections.
Story ideas from the data
America passes Japan on the robot league table
In 2025 the US installed more industrial robots than Japan, which fell to third place behind China and the US, according to the IFR. Which industries drove it, and does reshoring show up in robot orders?
38,428 units (International Federation of Robotics (IFR)) · 36,219 units (International Federation of Robotics (IFR)) · 36,766 (US$2.25bn) robots (Association for Advancing Automation)
China builds and buys most of the world’s robots
China installs more industrial robots than the rest of the top five combined, and Chinese makers now supply over half of its own market.
354,226 units (International Federation of Robotics (IFR)) · 55% percent (International Federation of Robotics (IFR)) · 2,027,200 vs 393,700 units (International Federation of Robotics (IFR))
Crop-spraying drones got cheaper, fast
US farmers paid far less per acre for drone spraying in 2025 while sprayed acreage rose. Who is flying them, and what happened to new drone sales?
$13 USD per acre (American Spray Drone Coalition) · over 16.4 million acres (American Spray Drone Coalition) · ~3,711 units (approx., estimate) (American Spray Drone Coalition)
How many humanoid robots are there, really?
The IFR counts almost 6,900 humanoids sold in 2025; an analyst estimate reported in the press was about twice that. The gap is about definitions, and it matters for every “humanoid boom” headline.
almost 6,900 units (approx.) (International Federation of Robotics (IFR)) · about 13,000 units (approx., analyst estimate) (TechNode) · 1,079 units (HKEXnews (Hong Kong Exchanges and Clearing))
What a humanoid robot costs to buy, rent or subscribe to
List prices now start in the low thousands of dollars, and you can rent one by the day. A price guide with sources.
from $4,900 USD (list price) (Unitree Robotics (online shop)) · from $13,500 USD (list price) (Unitree Robotics) · $20,000 or $499/month USD (1X Technologies) · from US$449/day USD per day (Tempo Robots)
Most robot work still has no price tag
Whirrwork’s dataset shows most robot jobs and most providers publish no price at all. Why the robot-services market still runs on “contact us”.
71% percent of jobs (Whirrwork) · 14% percent of providers (Whirrwork)
Labour shortages, not hype, may be the real robot driver
Record labour-shortage bankruptcies in Japan, hundreds of thousands of unfilled jobs in Korea, and most US contractors with craft workers reporting open craft jobs.
427 bankruptcies (Teikoku Databank (TDB)) · 467,000 (2.4%) workers (e-나라지표 (index.go.kr)) · 88% percent of firms (AGC of America)
Robotics money is back
Robotics start-ups raised more in the first half of 2026 than in all of 2025, according to Crunchbase data. Who is getting it, and who went bust?
$18.8 billion USD (venture funding) (Crunchbase) · $15 billion USD (venture funding) (Crunchbase) · 14 Dec 2025 date (iRobot Corporation)
Korea: the most automated factory workforce on earth
South Korea has 1,220 robots per 10,000 manufacturing workers, far ahead of every other country. What it looks like on the factory floor.
1,220 robots per 10,000 manufacturing employees (International Federation of Robotics (IFR)) · 818 robots per 10,000 manufacturing employees (International Federation of Robotics (IFR)) · 307 robots per 10,000 manufacturing employees (International Federation of Robotics (IFR))
The drone-delivery numbers are getting real
Walmart’s million deliveries, millions of sidewalk-robot deliveries, and robotaxi rides by the hundred thousand a week. Which services are scaling, and where?
more than one million deliveries (cumulative, lower bound) (Walmart Inc.) · 9+ million deliveries (cumulative, lower bound) (Starship Technologies) · 500,000 paid rides per week (TechCrunch)
How to cite Whirrwork
Source: Whirrwork (https://whirrwork.com), CC BY 4.0
Each statistic and report has APA, Chicago, MLA and BibTeX citations on its own page. For third-party figures, credit the original source too.
Licence and attribution
Text, statistics pages, charts and dataset releases are licensed under Creative Commons Attribution 4.0 (CC BY 4.0). Quoted passages remain the property of their publishers, and third-party figures should also be credited to their original source.
Attribution wording: Source: Whirrwork (https://whirrwork.com), CC BY 4.0 · CC BY 4.0